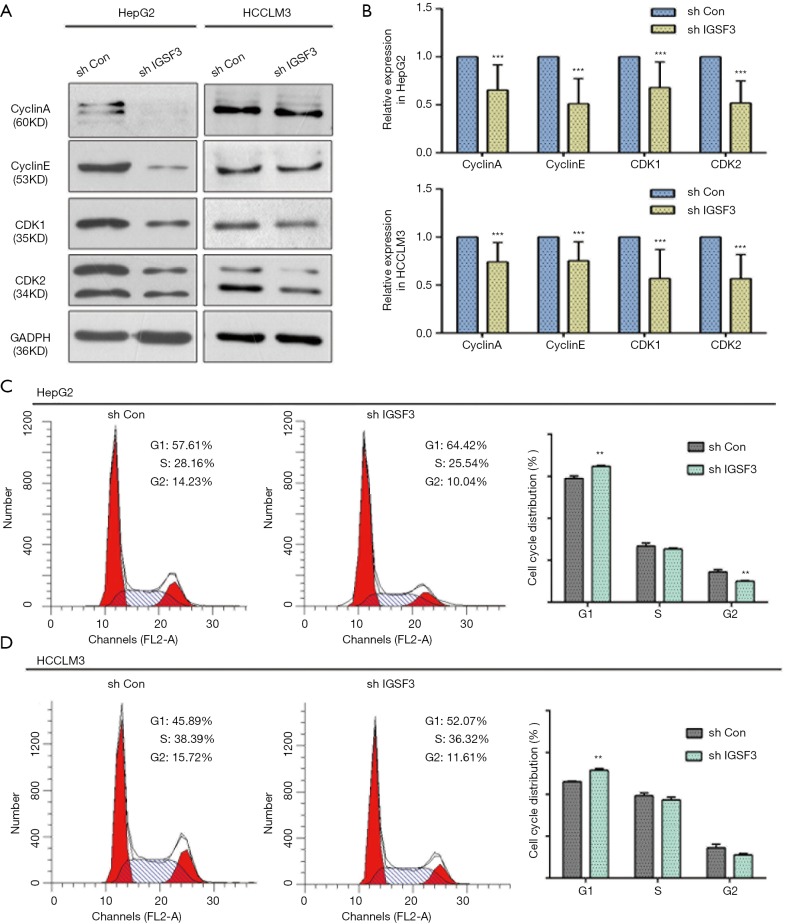
Figure 3.
IGSF3 affects HCC cell proliferation in vitro. (A,B) Western blot analyses of cyclin A, cyclin E, CDK1, and CDK2 levels in HCLLM3 and hepG2 cells. Bar graph shows cyclin A, cyclin D, CDK1, and CDK2 levels in HCLLM3 and hepG2 cells transfected with either shCON or shIGSF3; (C,D) FACS analysis results showing proportion of cells in each phase of the cell cycle. Bar graph shows the results of the number of cells in each phase of the cell cycle. All experiments were conducted three times. Results were indicated as mean ± SD (*, P<0.05; **, P<0.01; ***, P<0.001).

