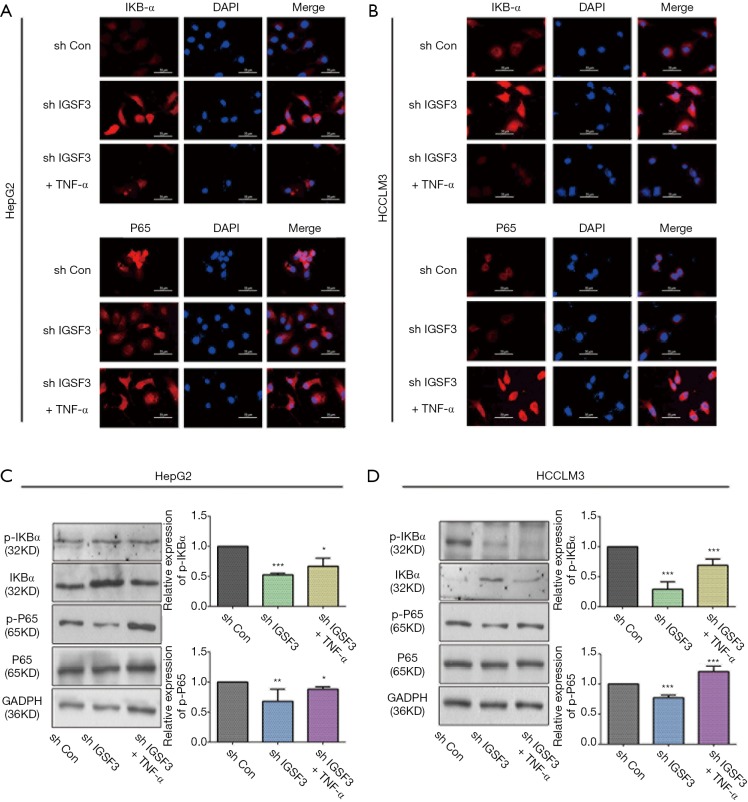
Figure 5.
IGSF3 actives the NF-B signaling pathways. (A,B) Characteristic IF images of NF-κB and IKBα in cell transfected with shCON, shIGSF3 and shIGSF3+TNF-α in representative HCC cell lines; (C,D) Western blot analyses of NF-κB, p-NF-κB, IKBα and p-IKBα expression in the experimental and control group in HCLLM3 and hepG2 cells. Bar graph shows the results of quantification of p-IKBα/IKBα and p-NF-κB/NF-κB. All experiments were performed three times. Results were represented as mean ± SD (*, P<0.05; **, P<0.01; ***, P<0.001).

