Figure 3.

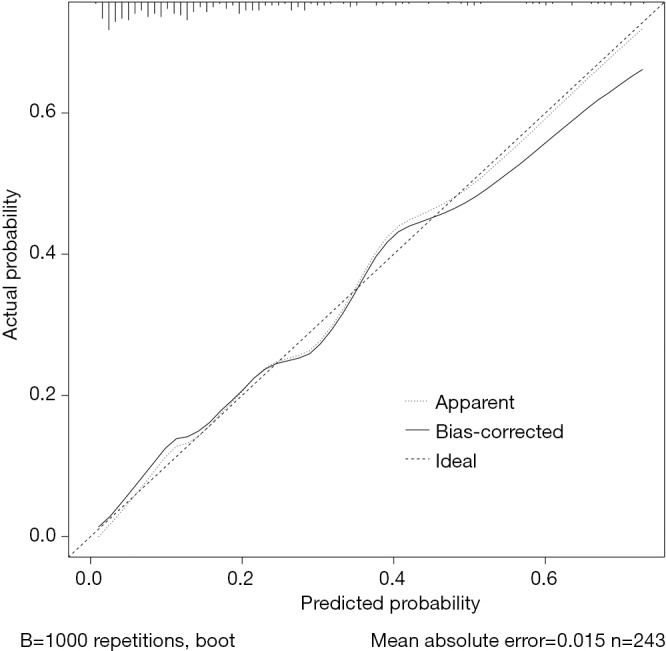
The calibration curves for the nomogram. The x-axis represents the predicted probability, and the y-axis represents the actual probability of LNM. LNM, lymph node metastasis.

The calibration curves for the nomogram. The x-axis represents the predicted probability, and the y-axis represents the actual probability of LNM. LNM, lymph node metastasis.