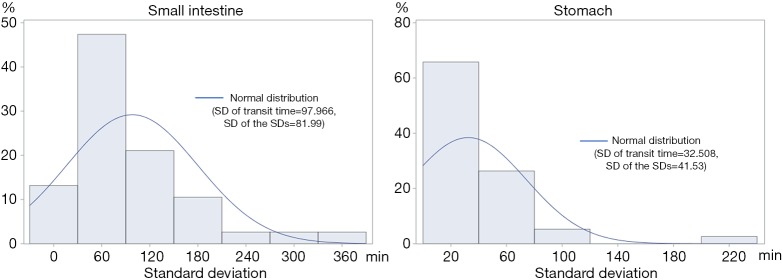
Figure 3.
Histogram variabilities within patient for SBTT and GTT. In SBTT, the variability presented a mean of 97.966 [SD (standard deviation of the variability) 81.99] min, whereas, in GTT, the mean and SD values were smaller [32.508 (SD: 41.53) min]. SBTT, small bowel transit time; GTT, gastric transit time.

