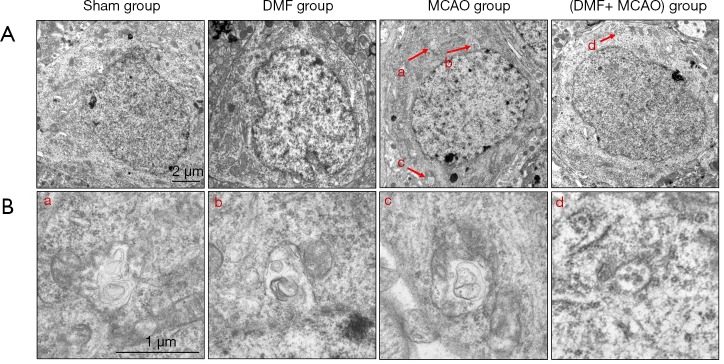
Figure 8.
Autophagesomes observed by transmission electron microscopy. Small letters in Figure 8A and B indicate autophagosomes and the corresponding amplified autophagosomes, respectively. (A) Transmission electron microscopy was used to observe autophagesomes (magnification ×10,000); (B) the amplified autophagosomes in (A) (magnification ×25,000).

