
Figure 3.
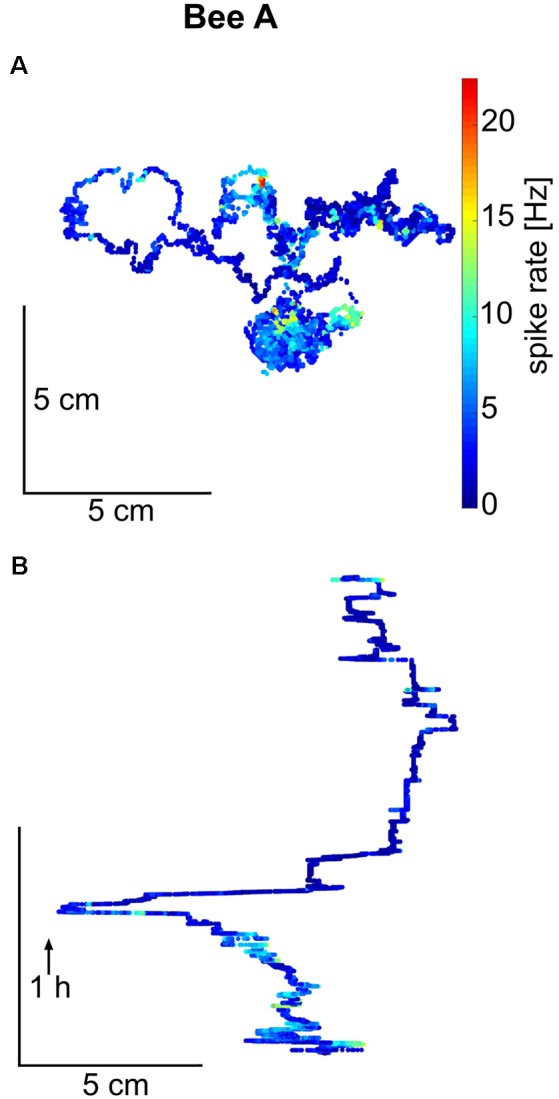
Trajectory and spike rate over time for honeybee A. (A) The total trajectory of bee A is plotted in two versions, as a projection on to the hive floor and in (B) as a trace over time for one spatial dimension (arrow indicates the direction of time). Spike rate (in 100 ms bins) is given in false colors on the trajectory. Bee A covered only a part of the hive floor and did not return to the same place multiple times from different directions. Similar walking trajectories are shown for the other bees in Supplementary Figure S3.