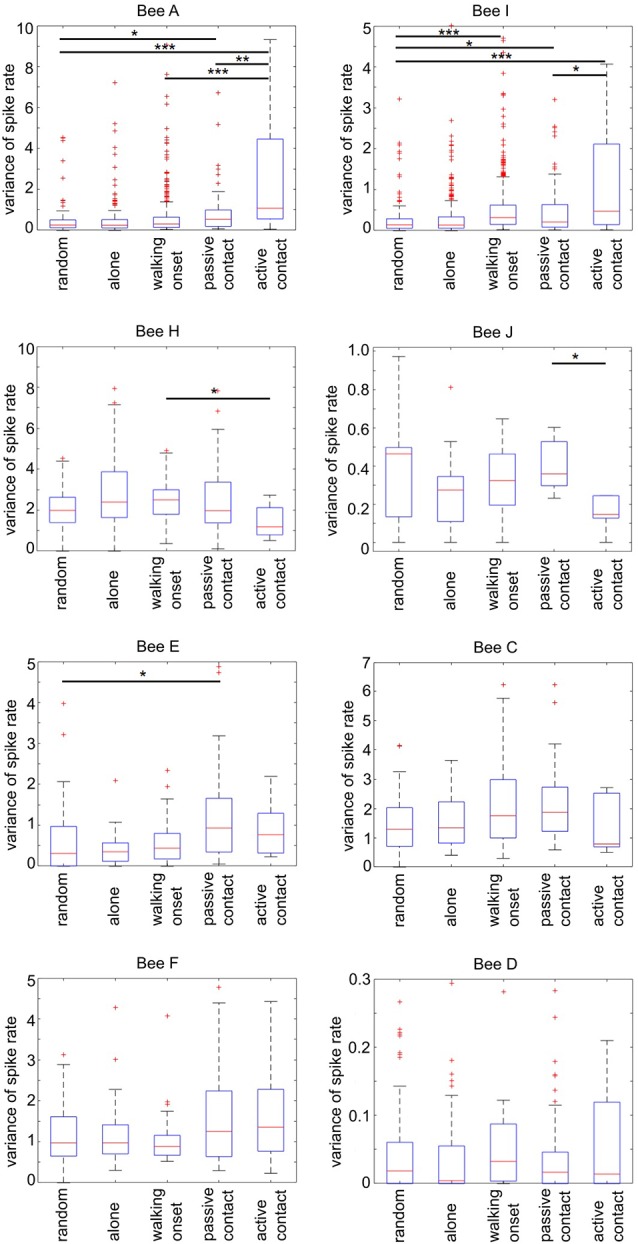
Figure 9.

Spike rate variance during different social states. Each graph plots separately for each focal bee the parameter of spike rate variance (ordinate) during a 4 s time window defined by five social states (for details see Figure 7). The number of “random” states was chosen to be equal to each of the naturally occurring “passive contact” states. Statistics (Wilcoxon rank-sum test). The horizontal lines mark the statistically significant differences in spike rate variance (Bonferroni corrected: alpha/6; one star: p ≤ 0.0083, two stars: p ≤ 0.0017, three stars: p ≤ 0.00083, Wilcoxon rank-sum test). Spike rate variance was significantly different in four animals out of eight between passive and active contact (focal bees A, I, H, J). Notice that the direction of difference was either higher variance in active contact (bees A and I) or lower (in bees H and J).
