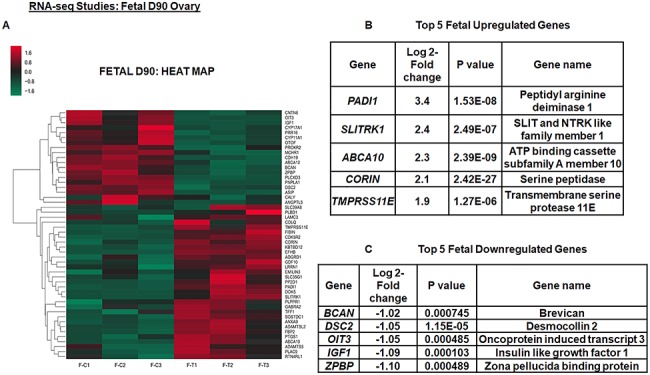
Figure 1.

Prenatal T exposure causes differential gene expression in fetal day 90 (D90) ovaries. Top 5 upregulated and downregulated genes for fetal D90 ovary within differentially expressed genes and its corresponding heat map (A–C). The heat map is constructed using rlog-transformed values obtained from RNA-seq data followed by z-normalization for fetal D90 ovaries. The Wald test was used to generate P-values and Log2 fold changes. Genes with adjusted P-values < 0.05 and absolute log2 fold changes > 1 were used as the threshold and called differentially expressed genes for each comparison
