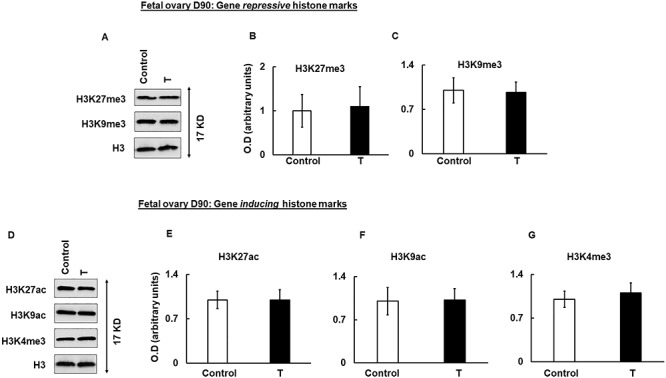
Figure 4.

Prenatal T-induced changes in histone marks in fetal day 90 (D90) ovaries. Representative immunoblots demonstrating the level of gene-repressive (H3K27me3 and H3K9me3) (A) and gene-inducing (H3K27ac, H3K9ac, and H3K4me3) histone marks in fetal day 90 (D90) ovaries isolated from control and prenatal T-treated sheep. Densitometric analysis of the gene repressive (B, C) and gene inducing (E–G) immuno blots. Each experiment consisted of n = 3 ovaries from fetal D90 animal per treatment group (control and T). Data are displayed as mean ± SE and normalized to H3.
