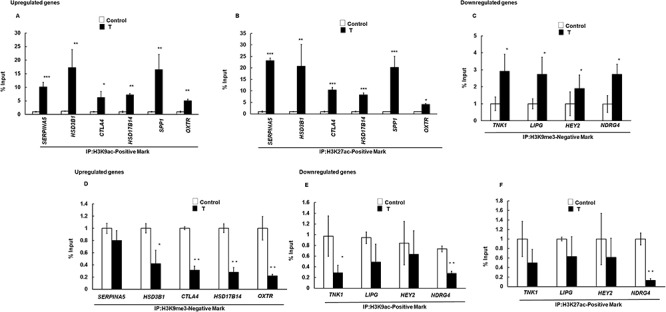
Figure 6.

Prenatal T exposure changes the level of gene-inducing and gene-repressive histone marks on differentially expressed genes in adult year 2 (Y2) ovaries. Epigenetic marks were determined by ChIP assay in the whole ovary isolated from prenatal T-treated adult Y2. A, B: Levels of H3K9ac and H3K27ac positive mark on the promoter region of upregulated ovarian genes. C: Level of H3K9me3 negative mark on the promoter region of downregulated ovarian genes. D: Level of H3K9me3 on the promoter region of upregulated ovarian genes. E, F: Levels of H3K9ac and H3K27ac positive mark on the promoter region of downregulated ovarian genes. Values represent percentage input (mean ± SE, each experiment consisted of n = 3 ovaries from adult Y2 animal per treatment group (control and T). *P ≤ 0.05 vs. control, **P ≤ 0.01 vs. control and ***P ≤ 0.005. IP-immunoprecipitation.
