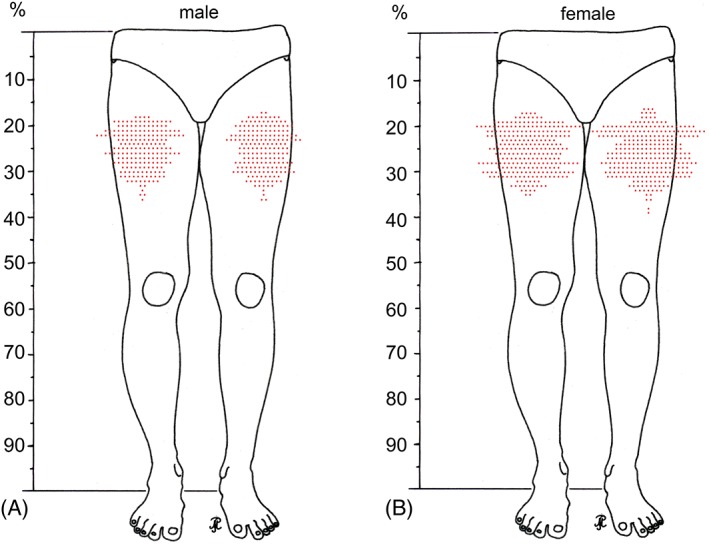
Figure 5.

(A,B) The line drawings show the distribution pattern of perforating arteries passing between the adductor muscles and the body of the femur in percentage of the leg length. Each point represents a singular vessel. The figures summarize the findings in all male (n = 41) (A) and all female individuals (n = 59) (B) separated for left and right legs. [Color figure can be viewed at http://wileyonlinelibrary.com]
