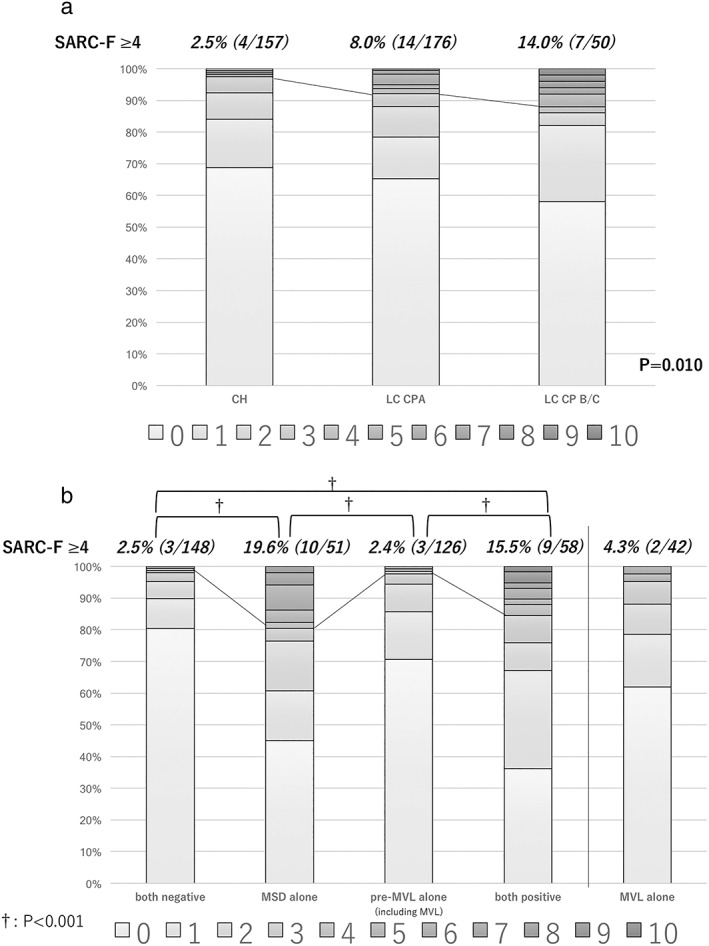
Figure 1.

(a) Distribution of SARC‐F scores in each stage of chronic liver disease. Frequency of high SARC‐F score (≥4) related to chronic liver disease progression (P = 0.01). (b) In contrast, the distribution of the SARC‐F score in each situation of muscle (both negative for muscle strength decline [MSD] and pre‐muscle volume loss [pre‐MVL], MSD alone, pre‐MVL alone [including MVL], and both positive for them). The frequency of high SARC‐F score (≥4) was smaller (2.4%) for patients only with pre‐MVL, as well as those without MSD and pre‐MVL (2.5%). In addition, the distribution of SARC‐F in MVL alone was also shown (4.3%). Patients with MSD showed a significant larger number of high SARC‐F scores, as compared with those without (P < 0.001 in Holm's method, respectively). †P < 0.001
