Figure 1.

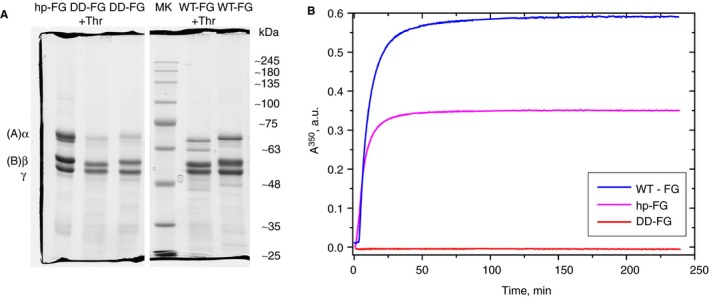
Polymerization kinetics of fibrinogen preparations. (A) SDS‐PAGE on a 10% PAA gel under reducing conditions (two portions of the same gel) of control samples (hp‐FG, DD‐FG, and WT‐FG), samples from the turbidity experiment after thrombin (Thr) addition (DD‐FG + Thr and WT‐FG + Thr), and a molecular weight marker (MK). The normal FG chains positions are indicated on the left side; the standards molecular weights listed on the right side are only indicative. (B) turbidity time course of WT‐FG (blue trace), hp‐FG (magenta trace), and DD‐FG (red trace), all at 0.3 mg/mL, after activation with thrombin at 0.08 NHIu/mL (0.28 NIHu/mg FG)
