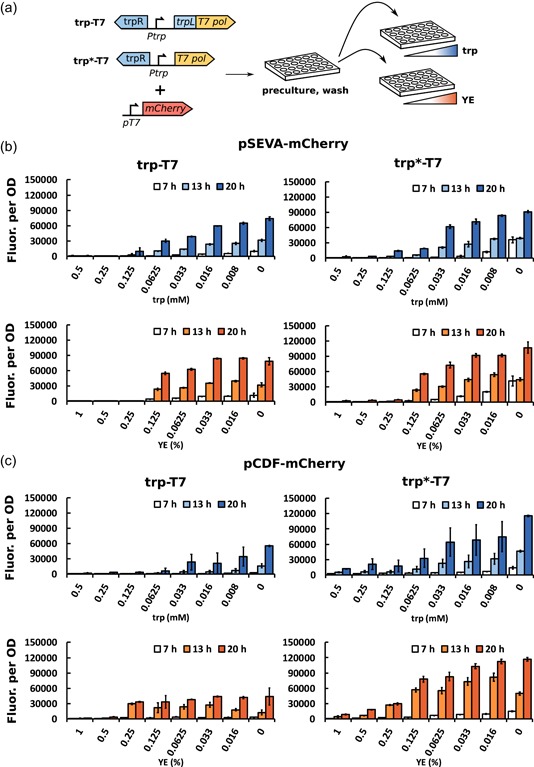
Figure 2.

Experiment layout and fluorescence per OD after 7, 13, and 20 hr for strains harboring the trp‐T7 or trp*‐T7 expression system. The strains were grown with different starting concentrations of tryptophan (trp) or yeast extract (YE). (a) Experiment scheme. (b) Fluorescence per OD for strains trp‐T7 and trp*‐T7 with mCherry expressed from low‐copy plasmid pSEVA. (c) Fluorescence per OD for strains trp‐T7 and trp*‐T7 with mCherry expressed from high‐copy plasmid pCDF. The different time points are shown in bright (7 hr), medium (13 hr), or dark (20 hr) shades of blue or orange for strains grown with tryptophan or YE, respectively. The fluorescence per OD was calculated as the average of three biological replicates. The standard deviations are shown as error bars [Color figure can be viewed at http://wileyonlinelibrary.com]
