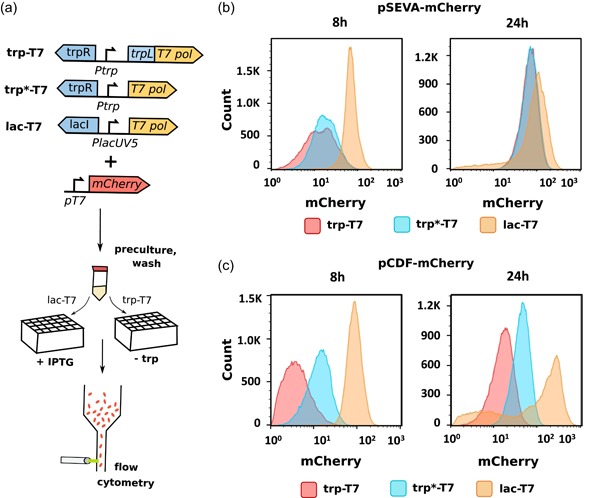
Figure 3.

Histograms showing the fluorescence of strains trp‐T7, trp*‐T7, and lac‐T7 after 8 and 24 hr of growth. (a) Experiment scheme. (b) Fluorescence of strains with mCherry expressed from low‐copy vector pSEVA. (c) Fluorescence of strains with mCherry expressed from high‐copy vector pCDF. mCherry was induced by growth in tryptophan deplete medium (trp‐T7, trp*‐T7) or by addition of 1 mM IPTG (lac‐T7). Each histogram shown is a representative sample out of three biological replicates. IPTG, isopropyl β‐d‐1‐thiogalactopyranoside [Color figure can be viewed at http://wileyonlinelibrary.com]
