
Figure 6.
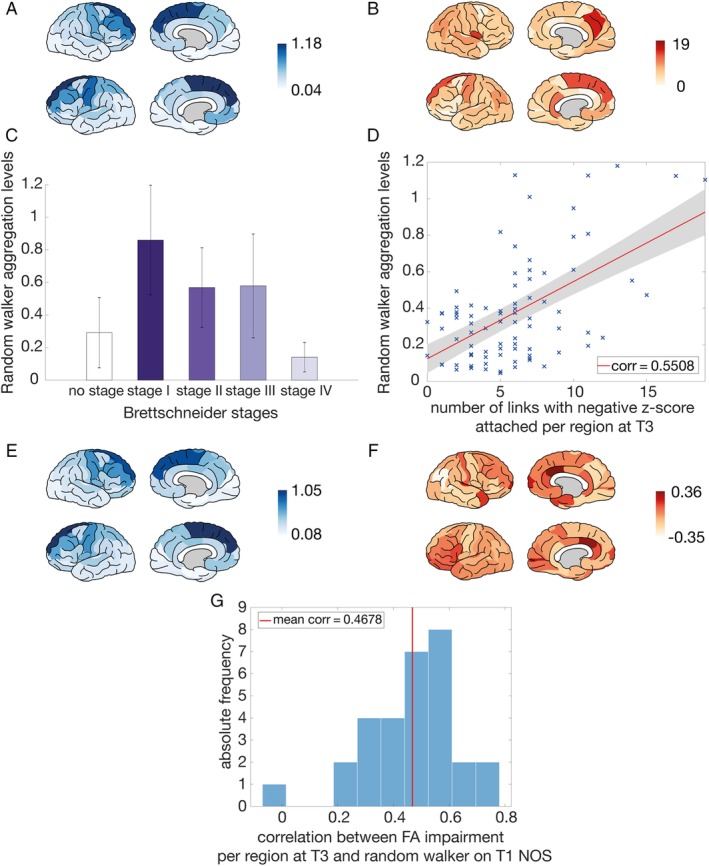
Validation based on an external dataset from the Trinity College Dublin (dataset III). (A) Random walker aggregation levels simulated on the group‐averaged connectome with number of streamlines (NOS) as a link weight based on 30 amyotrophic lateral sclerosis (ALS) patients at T1. (B) The empirical impairment for each region at T3 (determined as the number of links that possessed a negative z score with respect to the control group). (C) Simulated average aggregation levels per region when dividing the brain regions into the Brettschneider stage I, stage II, stage III, and stage IV regions ("no stage" refers to the average aggregation level of all other regions not involved in the neuropathology of Brettschneider). (D) Random walker aggregation levels simulated on the group‐averaged ALS connectome (NOS link weights) at T1 against the empirical impairment for each region at T3 (determined as the number of links that possessed a negative z score with respect to the control group). This relation resulted in a correlation coefficient of 0.5508 (p = 6.8*10−8). (E) Random walker aggregation levels simulated on the T1 connectome with NOS as a link weight averaged over all individuals for each region. (F) Empirical impairment at T3 for fractional anisotropy (FA) for the dataset of 30 longitudinal individual ALS patients. For each region, we calculated a z score compared with the respective control group and visualized the average over all individuals. (G) Histogram of all correlation coefficients of the random walker results, simulated on the T1 connectome (with NOS as a link weight) versus the empirical impairment at T3 for FA for the dataset of 30 longitudinal individual ALS patients. For each region, we counted the number of attached links with a negative z score. The average correlation coefficient was 0.4678, and 23 of 30 individuals reached significant correlations after Bonferroni correction. [Color figure can be viewed at http://www.annalsofneurology.org]