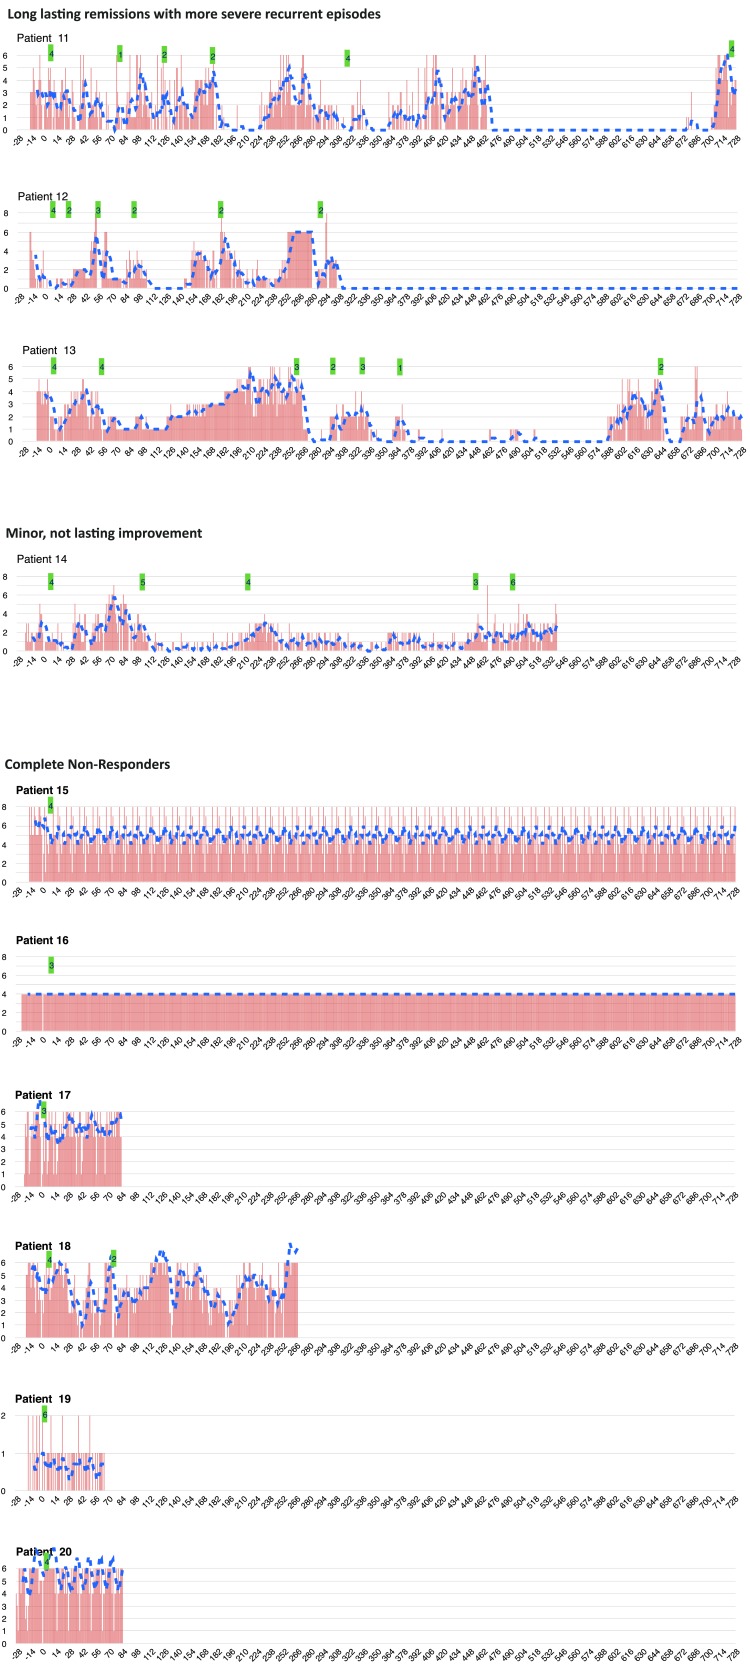
Figure 1.
X axis = no. of days of follow up; y axis = no. of attacks a day. Red bars = no. of attacks a day; blue dotted line = 7-day moving average. Green label = no. of PBCS treatments at this time point. Patient 15–20 discontinued headache diary, they were followed up by telephone interview and last value carried over method was used to impute missing data.

