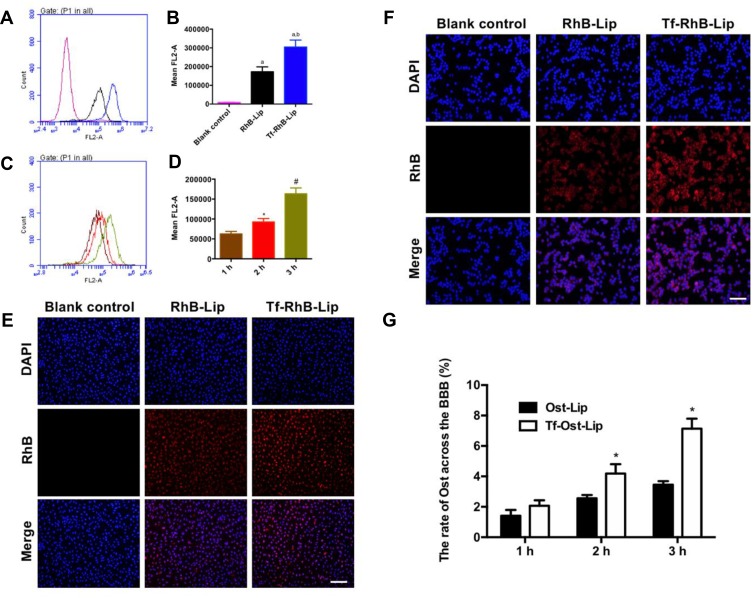
Figure 3.
Cellular uptake and distribution after incubation with varying formulations. (A) Cellular uptake of hCMEC/D3 cells treated with RhB liposomes and Tf-modified RhB liposomes; (B) Quantitative analysis of fluorescence intensity; Data are presented as mean ± SD (n=3). a, vs Blank control; b, vs RhB liposomes. P<0.05; (C) Cellular uptake of hCMEC/D3 cells treated with Tf-modified RhB liposomes at different time points; (D) Quantitative analysis of fluorescence intensity; Data are presented as mean ± SD (n=3). *, vs 1 h; #, vs 2 h. P<0.05. (E) Analysis of fluorescence intensity of hCMEC/D3 cells incubated with the varying liposomal formulations by fluorescence microscopy, scale bar=100 μm (n=3). (F) Cellular uptake of SH-SY5Y incubated with the varying liposomal formulations by fluorescence microscopy in a co-culture model, scale bar=50 μm (n=3). (G) The ratio of Ost transported across the BBB in vitro (n=3). *, vs Ost-Lip. P<0.05.

