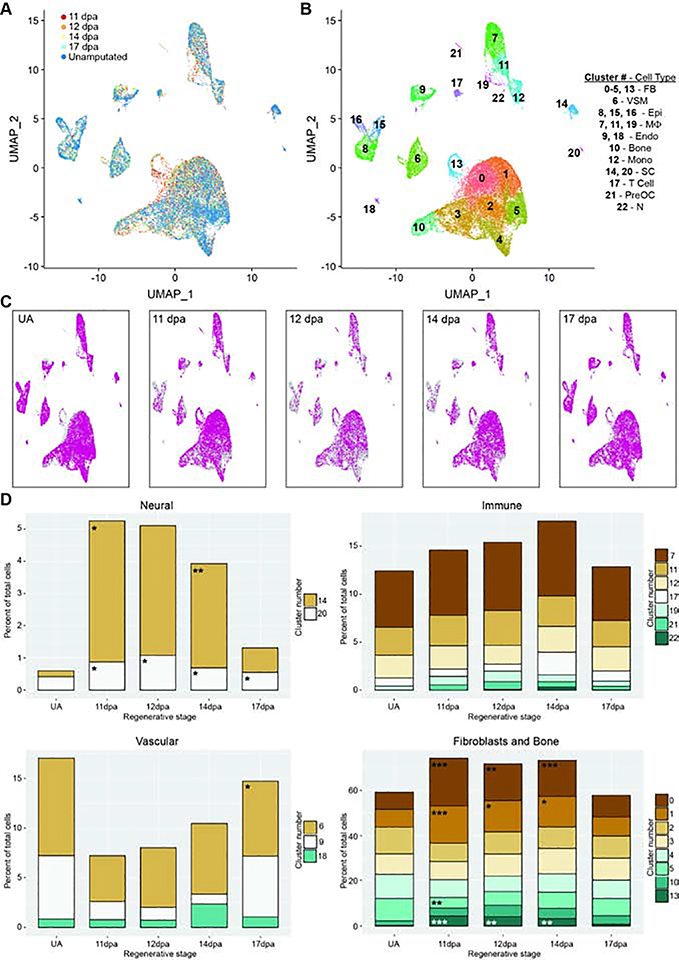
Figure 3. Integrated analysis of single cell populations through a regenerative time course.
All analyses use combined and normalized 11dpa, 12dpa, 14dpa, 17dpa, and unamputated (UA) scRNAseq data sets. (A) UMAP plot of integrated data sets colored by regenerative stage: 11dpa (red), 12dpa (orange), 14dpa (yellow), 17dpa (light blue), and unamputated (blue). (B) UMAP plot of integrated data sets showing clusters and cluster cell type annotations. Assigned cell types are: fibroblasts (FB; clusters 0–5, and 13), vascular smooth muscle cells (VSM; cluster 6), epithelial cells (Epi; clusters 8, 15, and 16), macrophages (Mф; clusters 7, 11, and 19), endothelial cells (Endo; clusters 9 and 18), bone (cluster 10), monocytes (Mono; cluster 12), Schwann cells (SC; clusters 14 and 20), T cells (cluster 17), pre-osteoclasts (PreOC; cluster 21), and neutrophils (N; cluster 22). (C) UMAP plot of integrated data set (gray) showing the cluster distribution of cells from each regenerative stage (pink). (D) The percentage of total cells represented by each cluster for the given regenerative stage. Each stage has been compared to the proportion of cells in UA, and significant changes were determined by differential proportion analysis (marked with asterisk); all p-values reported in Table S4. Clusters are categorized by overarching cell types (fibroblast or bone, immune, vasculature, or neural). Significance values are as follows: * denotes p<0.05, ** denotes p<0.01, *** denotes p<0.001.

