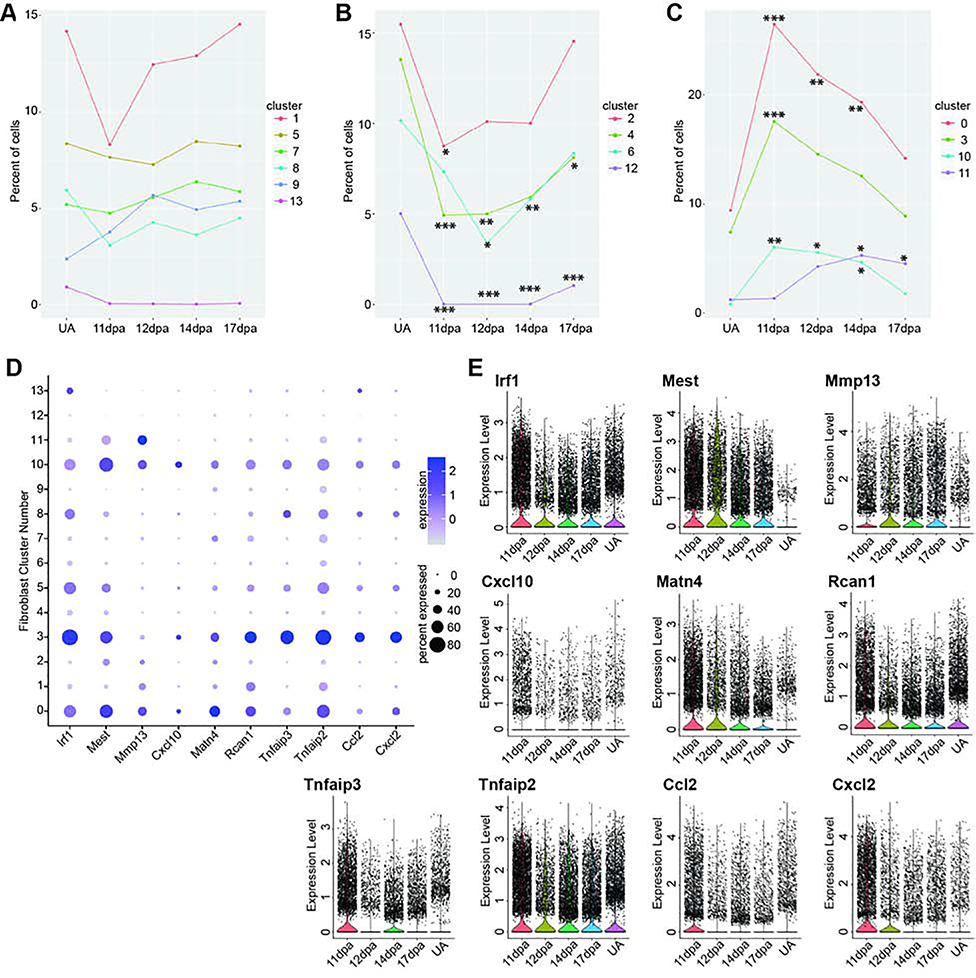
Figure 6. Analysis of blastema fibroblast population dynamics.
Differential proportion analysis of fibroblast clusters parsed by regeneration profile where clusters in (A) have no significant population dynamics between blastema stages and unamputated. (B) Cells in clusters 2, 4, 6, and 12 are significantly depleted as compared to unamputated and (C) cells in clusters 0, 3, 10, and 11 are enriched during regeneration as compared to unamputated. Significance values are as follows: * denotes p<0.05, ** denotes p<0.01, *** denotes p<0.001. All p-values are presented in Table S6. (D) Subset of genes enriched in blastema stages as compared to unamputated. Gray depicts low expression and dark purple is high expression; small circles depict a low percentage of cells and large circles depict a high percentage. (E) Violin plots of genes in (D) at four blastema stages as compared to unamputated. Black points represent individual cells and the colored curve shows the distribution of cells at a given expression level.

