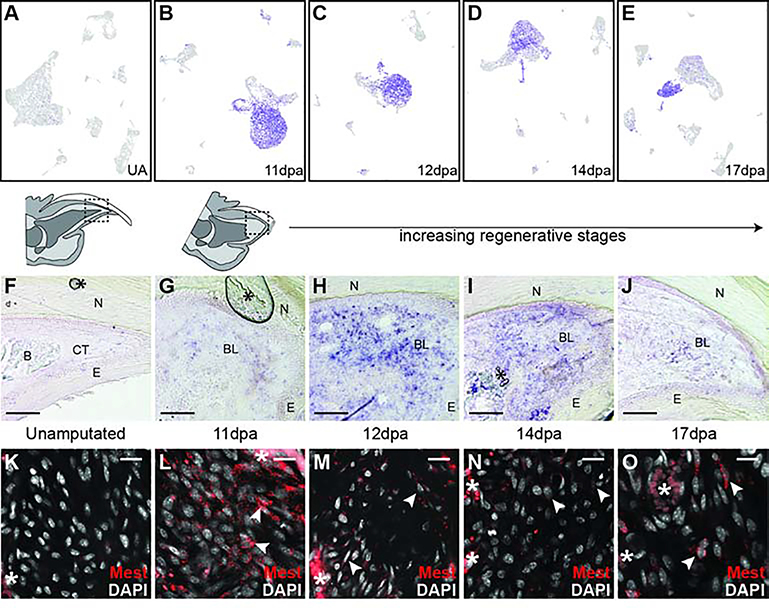
Figure 7. Mest expression during digit tip regeneration.
(A-E) UMAP feature plots of Mest expression in all digit tip cells in UA, 11dpa, 12dpa, 14dpa, and 17dpa, respectively. Purple marks high expression and gray marks low expression; plots refer to Figures S5, S4, S3, S2, and 1, respectively. (F-J) DIG-labeled RNA section in situ hybridization for Mest on unamputated and regenerating digit tips. (F) Unamputated digit tip with orientation shown by schematic above. (G) 11dpa with region of the blastema depicted in the schematic above. Additional regenerative stages include (H) 12dpa, (I) 14dpa, and (J) 17dpa. Asterisks (*) denote artifacts from coverslipping. Abbreviations: (N) nail, (CT) connective tissue, (E) epithelium, (B) bone, (BL) blastema. Scale bar = 100μm. (K-O) HCR RNA FISH for Mest. (K) Mesenchymal region in the unamputated digit tip. (L-O) Mid blastemal region in (L) 11dpa, (M) 12dpa, (N) 14dpa, and (O) 17dpa blastemas. Arrows denote examples of Mest positive cells. Asterisks (*) denote blood vessel/RBC autofluorescence. Scale bar = 20μm.

