
Figure 2.
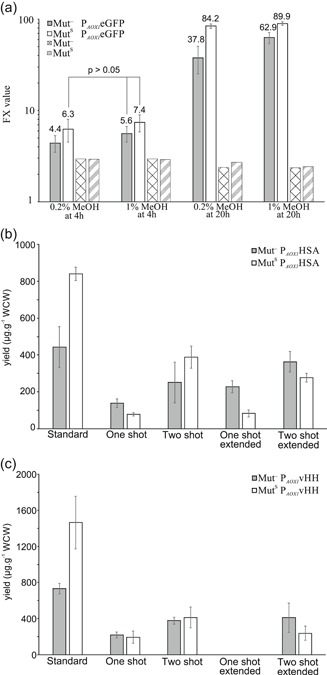
(a) Mean promoter expression levels with PAOX1eGFP of ten transformants, FX = (FL1/FS1.5) × 8,000. All measurements in pairwise comparison are significantly different according to Student's t test except for those indicated by p > .05. (b) Secreted protein production screening using different protocols with PAOX1HSA and (c) PAOX1vHH