
Figure 5.
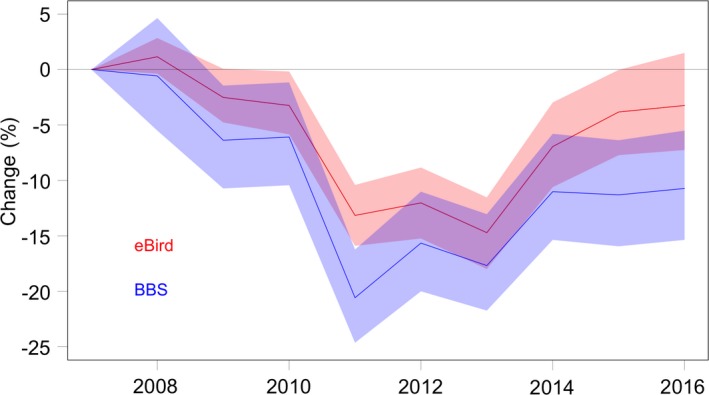
Wood Thrush range‐wide breeding season population trajectories for eBird and BBS. The trajectories show the estimated range‐wide changes in population size standardized as the percent change since 2007. The dark lines indicate the conditional mean estimates and the polygons are corresponding 95% confidence intervals. The eBird estimate is shown in red and the BBS estimate in blue.