
Figure 2.
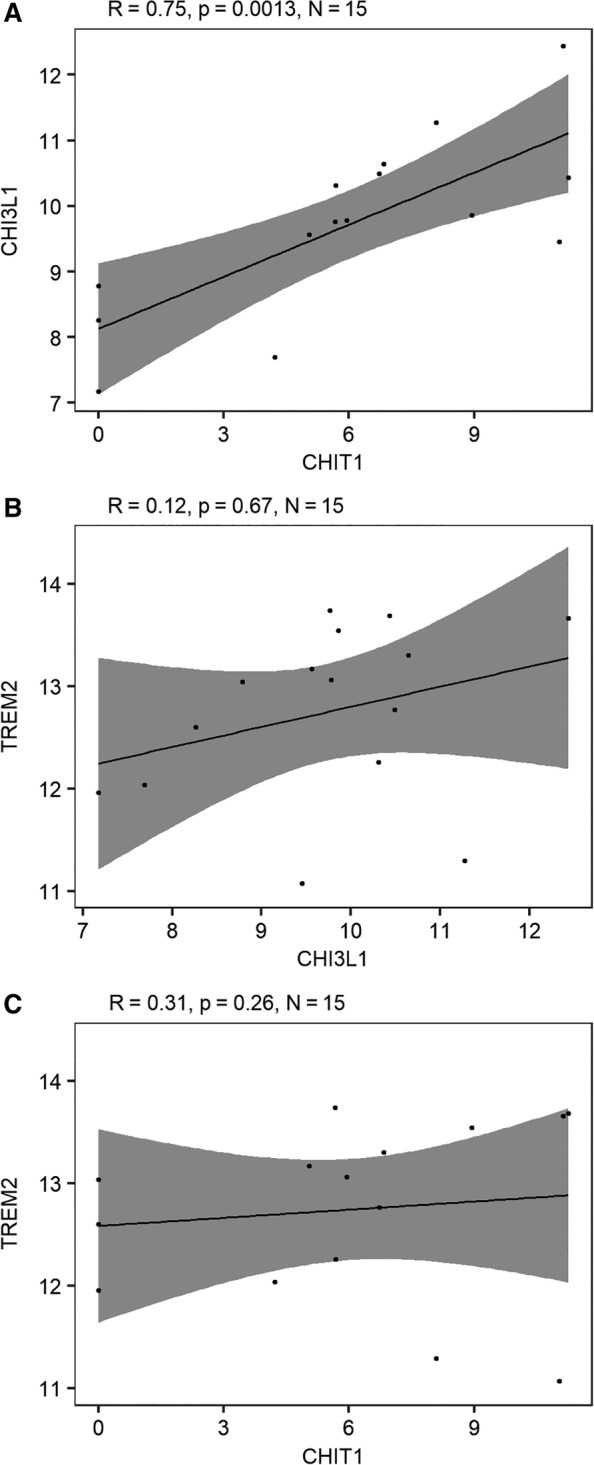
Correlations between microglial marker RNA expression in brain tissue (corpus callosum) of multiple sclerosis patients.6 Pairwise comparisons of gene expression extracted from publicly available data deposited in the Gene Expression Omnibus database originating from Van der Poel et al6: (A) chitotriosidase (CHIT1) versus chitinase‐3–like protein 1 (CHI3L1), (B) CHI3L1 versus triggering receptor expressed on myeloid cells 2 (TREM2), and (C) CHIT1 versus TREM2. Raw values of RNA‐seq counts were replaced with (value +1) because of the presence of zero values before taking the logarithmic transformation with base 2 as conventional in RNA expression data. Probability values are derived from Pearson test. Gray shading shows the 95% confidence bands.