
Figure 2.
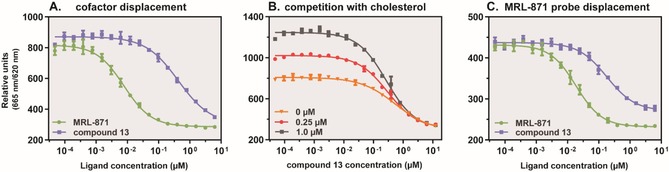
Bio‐chemical assay data for MRL‐871 and compound 13. (A) Dose‐response curves from the TR‐FRET coactivator recruitment assay for MRL‐871 and compound 13; (B) Dose‐response curves from the competitive TR‐FRET coactivator recruitment assay for compound 13, with fixed concentrations of cholesterol (0 μM, 0.25 μM and 1.0 μM); (C) Dose‐response curves from the ligand displacement TR‐FRET assay for MRL‐871 and compound 13, using a fluorescently labelled MRL probe. Data adapted from Meijer et al. 2020.16