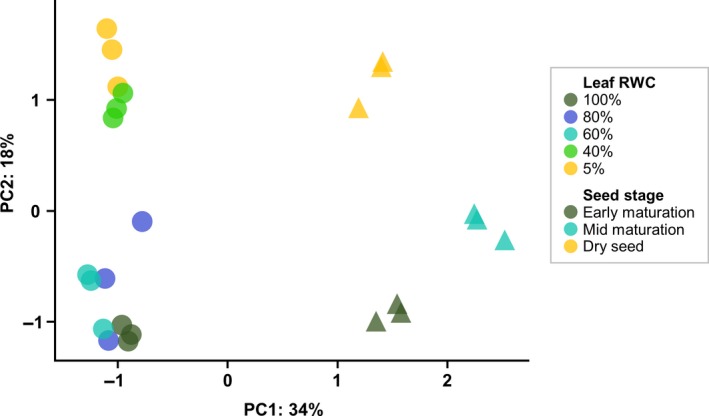
Figure 2.

Principal component analysis (PCA) plot of seed and leaf RNA‐Seq libraries.
Plots were generated using regularised log‐normalised read counts. PC1 separates samples on experiment (tissue type) and PC2 by water content.

Principal component analysis (PCA) plot of seed and leaf RNA‐Seq libraries.
Plots were generated using regularised log‐normalised read counts. PC1 separates samples on experiment (tissue type) and PC2 by water content.