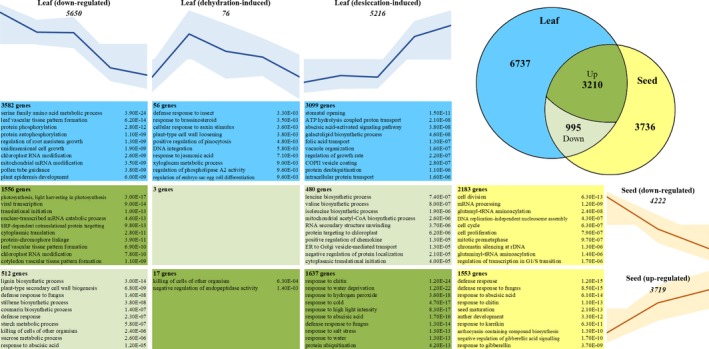
Figure 3.

Number, overlap and gene ontology (GO) enrichment of genes differentially expressed (DE) during vegetative desiccation tolerance (VDT) and seed maturation.
Genes only DE in leaf tissue (blue) are grouped based on expression pattern as downregulated (most highly expressed at 100% relative water content (RWC)), dehydration‐induced (most highly expressed at 80–60% RWC) or desiccation‐induced (most highly expressed at 40–5% RWC). Seed‐specific DE genes (yellow) are classified as downregulated (expressed at early maturation) or upregulated (most highly expressed mid−late maturation). Gene sets that are DE in both tissues are shown in green, with the darker shade indicating those that display the same direction of regulation during VDT and seed maturation. Expression profiles show the average scaled expression with standard deviation (shaded) for each gene in that cluster. The number of genes in each group is indicated, as are the 10 most significantly over‐represented GO terms in that set, in descending order of significance (P < 0.01).
