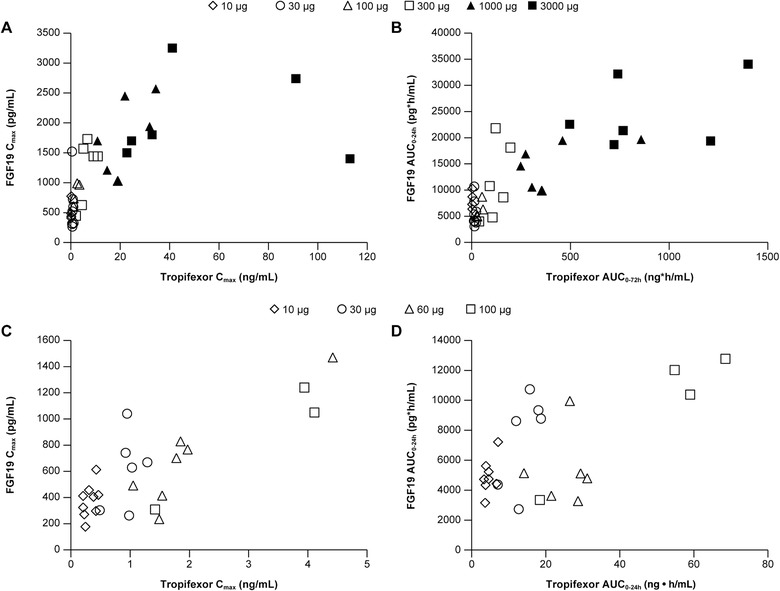
Figure 3.

Pharmacokinetic‐pharmacodynamic relationship. Scatter plots of (A) FGF19 observed maximum plasma concentration following drug administration (Cmax) vs tropifexor Cmax and (B) FGF area under the plasma concentration‐time curve from time 0 to 24 h (AUC0‐24h) vs tropifexor AUC0‐24h following single ascending doses of tropifexor in fasted subjects. Scatter plots of (C) FGF Cmax vs tropifexor Cmax and (D) FGF AUC0‐24h vs tropifexor AUC0‐24h following multiple ascending doses of tropifexor in lean healthy subjects.
