
Figure 2.
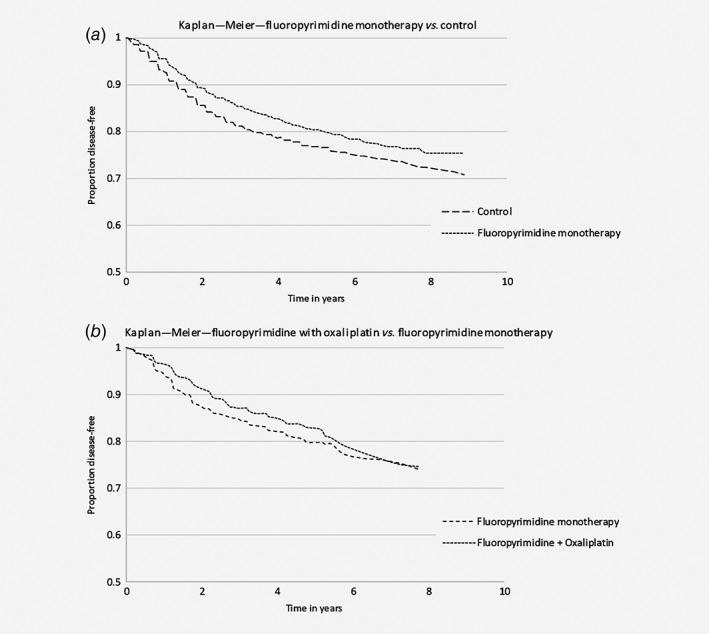
Kaplan–Meier curves for the treatment and control groups for pooled population 1 (a) and the curves for fluoropyrimidine combined with oxaliplatin compared to fluoropyrimidine monotherapy in pooled population 2 (b).
Official websites use .gov
A
.gov website belongs to an official
government organization in the United States.
Secure .gov websites use HTTPS
A lock (
) or https:// means you've safely
connected to the .gov website. Share sensitive
information only on official, secure websites.
Kaplan–Meier curves for the treatment and control groups for pooled population 1 (a) and the curves for fluoropyrimidine combined with oxaliplatin compared to fluoropyrimidine monotherapy in pooled population 2 (b).