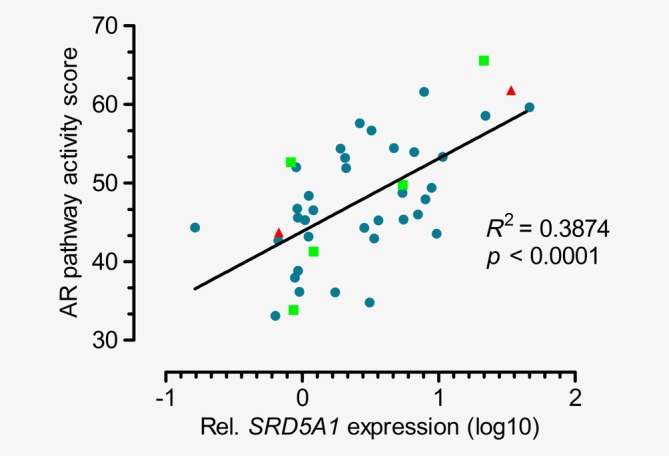
Figure 4.

Correlation of relative SRD5A1 expression levels (normalized to HPRT1 housekeeping gene levels) and AR pathway activity scores measured in primary salivary duct carcinomas (blue dots, n = 36), regional lymph node metastases (green squares, n = 5) and distant metastases (red triangle, n = 2) of patients in the recurrent/metastatic cohort and locally advanced cohort. R‐squared and p values of the linear regression analysis are shown. [Color figure can be viewed at http://wileyonlinelibrary.com]
