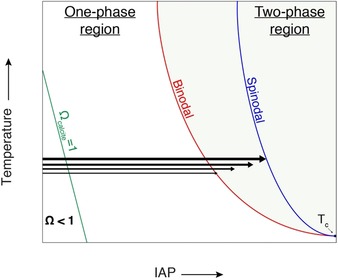
Figure 1.

Schematic illustration of the explanation of the observed rate dependency of ACC solubility. As proposed previously,27, 30 a submerged liquid–liquid miscibility gap is located in the metastable zone of the solid–liquid phase diagram (that is, at ion activity products (IAPs) corresponding to supersaturation ratios Ω>1 with respect to the stable solid, calcite). The liquid–liquid phase diagram exhibits a lower critical solution temperature T c. For the sake of clarity, only the calcite solid–liquid (S‐L) binodal curve is shown, and the right branch of the liquid–liquid miscibility gap defining the compositions of dense liquids is left out. Higher addition rates (bold arrows crossing the liquid–liquid binodal limit pointing from left to right) allow entry into the liquid–liquid miscibility gap to a greater extent than slow rates (corresponding to finer arrows) before demixing occurs, thus yielding more metastable dense liquids. When solid ACCs are subsequently formed by dehydration and solidification of the as‐formed precursor dense liquids, their solubilities directly reflect the metastability of the liquid precursors. Increasingly fast mixing (illustrated by progressively bolder arrows) of calcium and carbonate solutions will thus provide access to more and more metastable solid ACCs, with higher and higher solubilities. In this mechanism, the highest possible metastability of the dense liquid precursor, and, with it, the highest solubility of ACC, is defined by the spinodal limit.
