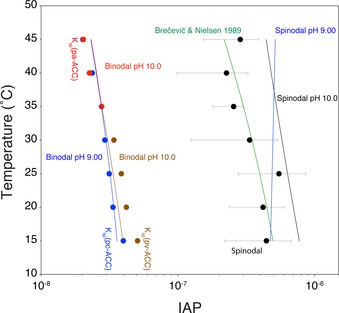
Figure 3.

Comparison of measured (data points) and theoretical binodal and spinodal limits (lines) defining the liquid–liquid miscibility gap of the aqueous calcium carbonate system, with pH‐dependent liquid–liquid amorphous polymorphism. Blue and brown data points illustrate experimentally determined binodal limits at pH 9.00 and pH 10.0 below 35 °C, respectively. Red data points show the experimentally determined binodal limit at pH 10.0 above 35 °C, and black data points show the experimentally determined spinodal limit at pH >10.0. The green line represents the solubility of ACC from the literature.33 Theoretical binodal and spinodal limits can be calculated from Equations (2) and (1) (derivation: see Discussions 3 in the Supporting Information), respectively, using the standard enthalpies and entropies compiled in Table S2, as well as the temperature dependency of the solubilities of the different polymorphs from the literature.42 The blue lines illustrate the theoretical binodal and spinodal curves at pH 9.00, the brown and red lines give the theoretical binodal limit at pH 10.0, accounting for proto‐calcite (pc), proto‐vaterite (pv), and proto‐aragonite (pa) ACCs with the distinct solubilities of the corresponding polymorphs, respectively. The black line represents the theoretical spinodal curve for pH 10.0, which should be compared to the experimental values obtained at high pH values. The blue line on the right is the theoretical spinodal limit at pH 9.00.
