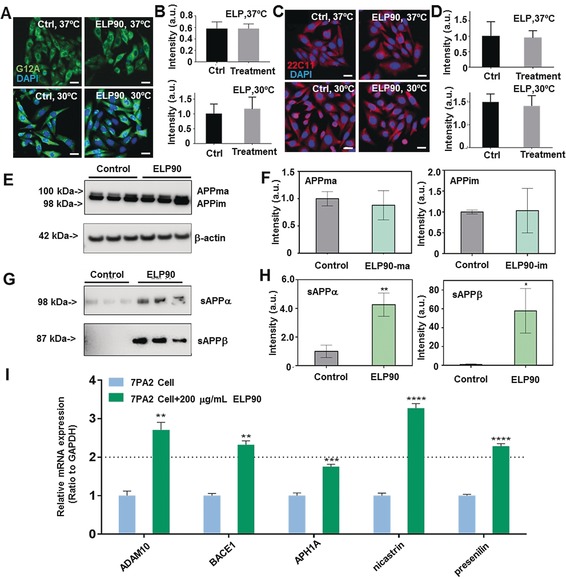
Figure 3.

Mechanistic study of upregulation of Aβ levels. A) The representative fluorescent images for visualization of full‐length APPs in 7PA2 cells treated with PBS and ELPs at 30 °C and 37 °C. The APPs are characterized by G12A antibody and imaged in green. The cell nuclei are stained by DAPI in blue. Scale bar, 20 μm. B) The quantification of full‐length APP levels in cells shown in (A). C) The representative fluorescent images for visualization of isoforms of APP in 7PA2 cells treated with PBS and ELPs at 30 °C and 37 °C. The APP variants were imaged in red and characterized by 22C11 antibody. Scale bar, 20 μm. D) Quantitation of levels of isoforms of APP presented in (C). E) Western blot (WB) images showing full length APPs, including mature and immature types. The bands were probed with G12A. F) The quantification of APP mature and immature bands. G) The characterization of soluble sAPPα and sAPPβ with WB protocol. The control groups were the characterization of PBS‐treated cells. H) The quantification of sAPPα and sAPPβ. I) The mRNA level changes of α‐secretase subunit (ADAM10), β‐secretase (BACE1) and γ‐secretase subunits (APH1A, nicastrin, and presenilin) after treatment with 200 μg/Ml ELP90 for 24 hours were analyzed by RT‐PCR. The 7PA2 cells treated without ELP90 were controls and the mRNA levels are normalized to 1. Data from triplicate tests were collected. (t‐test; n=3 per each group); All data are presented as mean±S.E.M.*, p<0.05; **, p<0.01; ***, p<0.001; ****, p<0.0001.).
