
Figure 2.
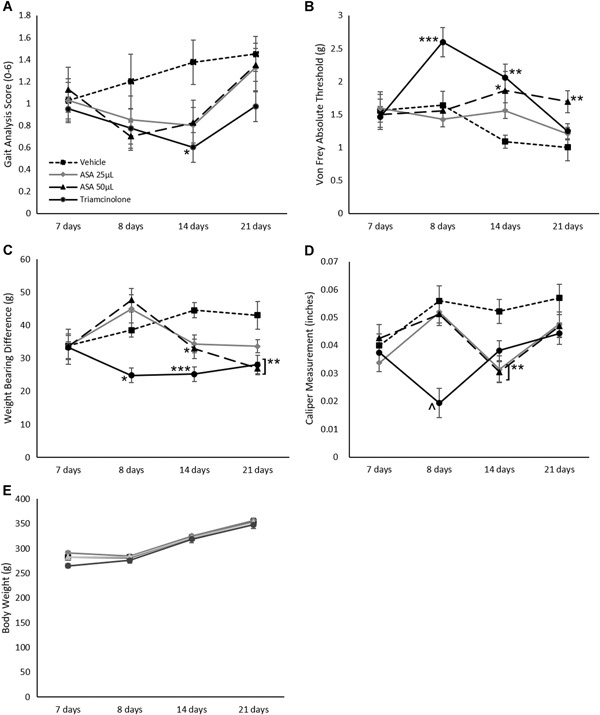
Rat behavioral testing results, including (A) gait analysis, (B) Von Frey analysis, (C) incapacitance testing, (D) knee caliper measurements, and (E) body weight changes. Mean ± standard error reported for each time point; n = 10 per group for all figures. *p < 0.05, **p < 0.01, and ***p < 0.001 to the vehicle control by Dunn's post hoc test