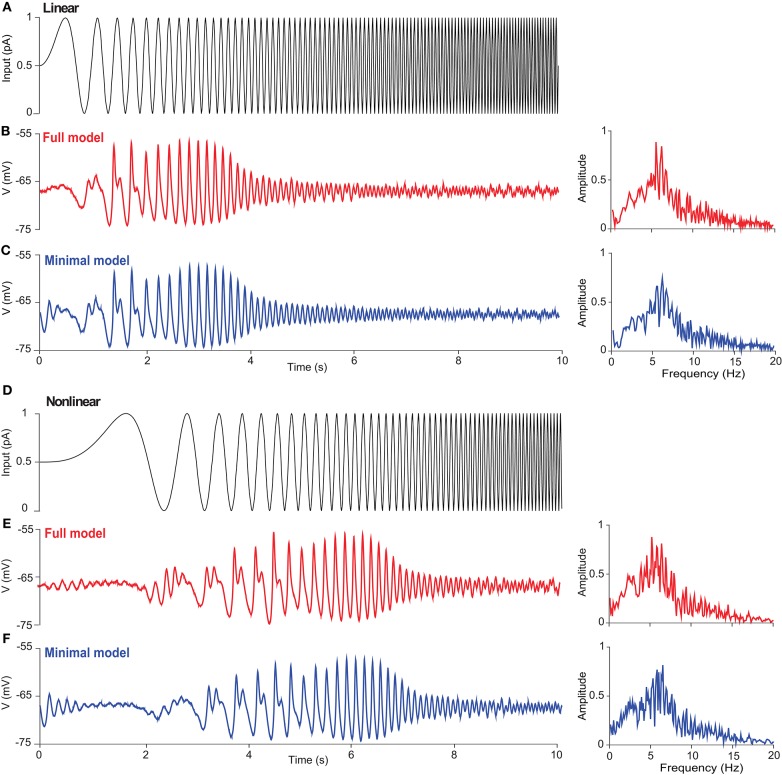
Figure 4.
Subthreshold resonance of a UBC in response to sinusoidal inputs with linearly and non-linearly increasing frequency. (A) Zap current input from 0 to 10 Hz linearly as Iinput = Iampsin(2f(t)t) with f(t) = fmaxt/T at Iamp = 1 pA, fmax = 10 Hz, and T = 10 s. (B) UBC voltage response triggered by the stimulus given in (A) in the full model. (Right) Fourier transform of UBC response showing the resonance of UBC dynamics with a peak frequency around 6 Hz. (C) Similar to (B) but simulated with the minimal model. (D) Zap current input from 0 to 10 Hz non-linearly as at Iamp = 1 pA. (E,F) Similar to (B,C) showing UBC response and resonance.

