
Figure 7.
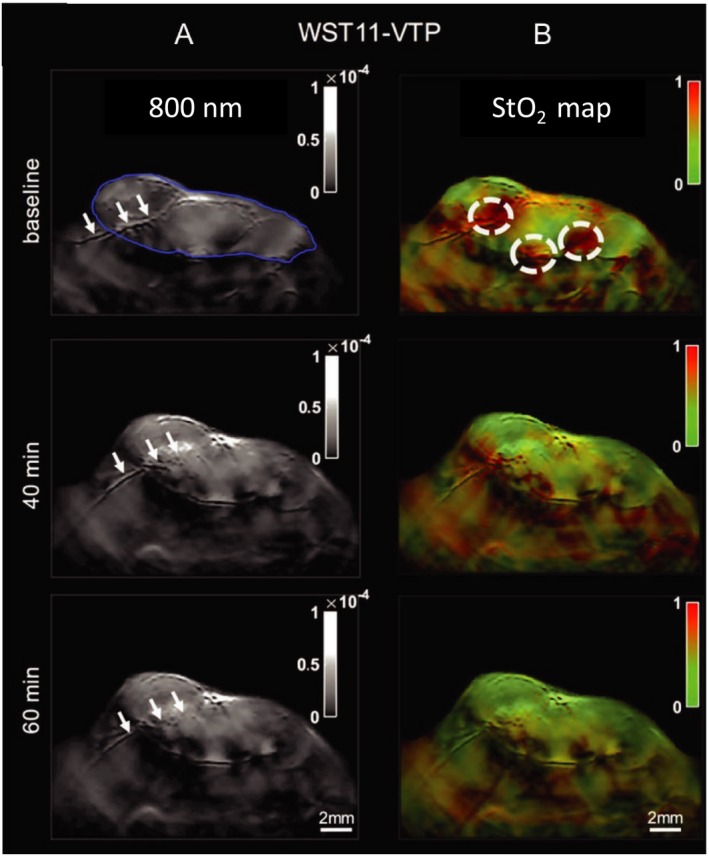
Photoacoustic imaging (multispectral optoacoustic imaging) of StO2 levels in renal carcinoma tumors following WST‐11‐mediated PDT. (A) Imaging of vascular morphological changes at baseline, 40 and 60 min post‐PDT. Blue outline of top‐left panel indicates tumor boundary, and white arrows point to a major vessel traversing through the tumor. At 60 min post‐PDT, clear structural ablation of this vessel can be seen. (B) StO2 map of treated region, indicating time‐dependent drop in StO2 content (shift from red (high) to green (low) StO2 values). Adapted with permission from 72.