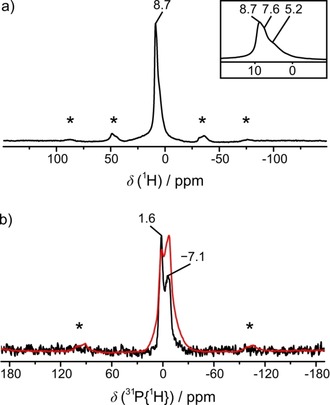
Figure 3.

Solid‐state NMR spectra of BaP6N10NH, measured at a sample spinning frequency of 50 kHz. a) 1H MAS NMR spectrum: One wide band can be identified as three individual signals with shifts of 5.2, 7.6, and 8.7 ppm in the magnified area. b) 31P MAS (black) and 31P{1H} (red) MAS cross polarization NMR spectra: Both show two peaks with chemical shifts of −7.1 and 1.6 ppm. Spinning side bands are marked with asterisks.
