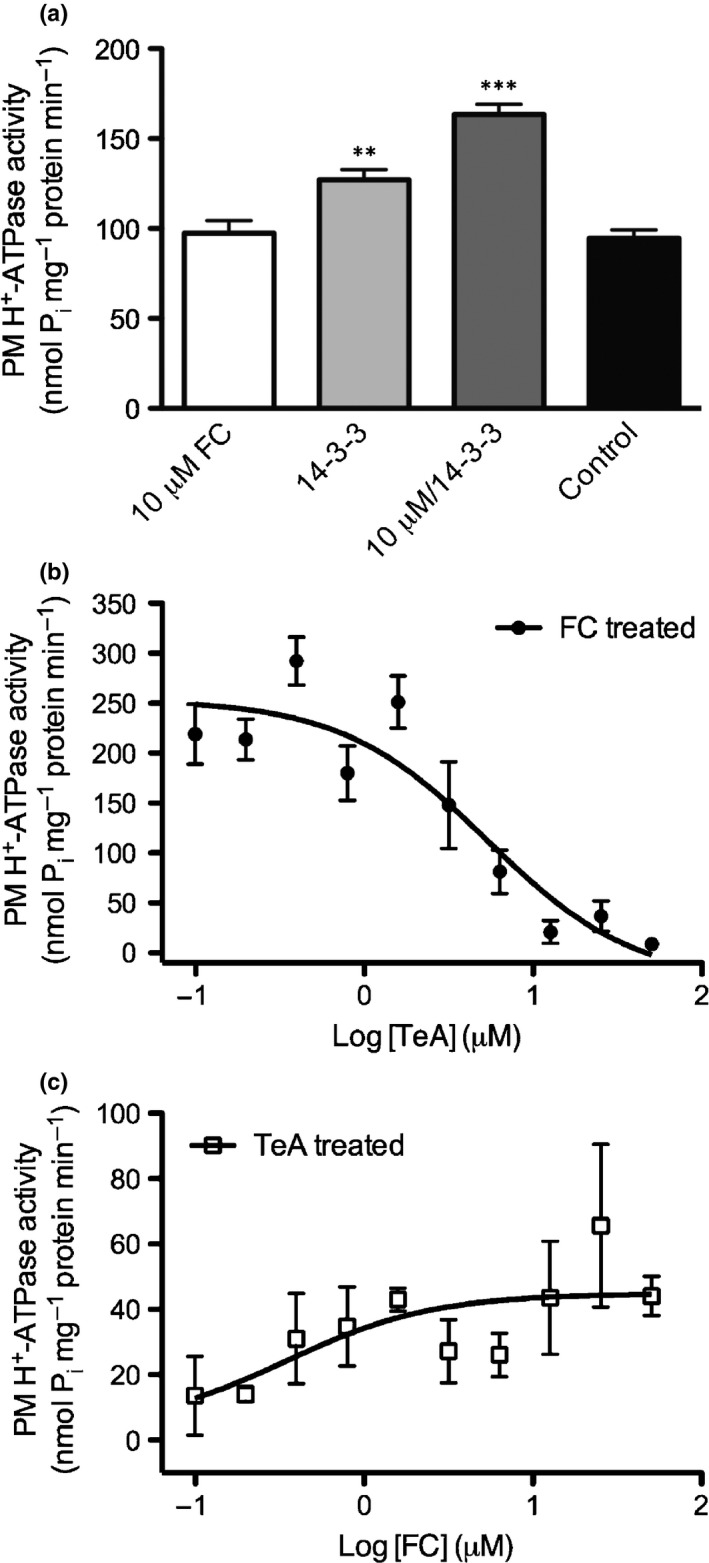
Figure 8.

Competition between Fusicoccin (FC) and tenuazonic acid (TeA). (a) Activation of Spinacia oleracea plasma membrane (PM) H+‐ATPase preincubated with either FC, 14‐3‐3 or FC/14‐3‐3 before assay start. (b) Dose‐dependent TeA inhibition of S. oleracea PM H+‐ATPase preincubated with FC and 14‐3‐3 protein before assay start. (c) Dose‐dependent FC/14‐3‐3 activation of S. oleracea PM H+‐ATPase preincubated with 20 μM TeA before assay start. (b, c) Data were analyzed using nonlinear regression and fitted to log[agonist] (μM) vs the normalized response (variable slope) to determine the half maximal effective concentration (EC50) value. FC (10 µM) and 14‐3‐3 (1 µg) were used in all treatments. Treatments with 14‐3‐3 alone or FC/14‐3‐3 were significantly different from nontreated (**, P < 0.01; ***, P < 0.001). Experiments were performed in triplicates of two independent PM fractions, and values represent means ± SEM (n = 6).
