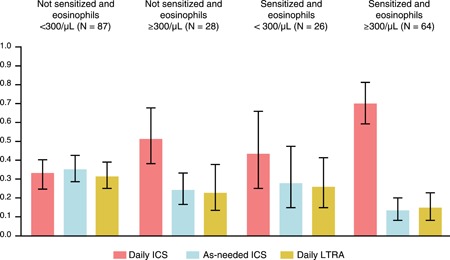
Figure 1.

The probability of best response based on combinations of sensitization and peripheral blood eosinophil count. P values correspond to the test of interaction between the predictor and treatment and indicate whether the pattern of treatment response differs according to subgroup. Sample sizes correspond to participants with evaluable data (N = 230). Reproduced with permission from Fitzpatrick et al 33 [Color figure can be viewed at http://wileyonlinelibrary.com]
