
Figure 3.
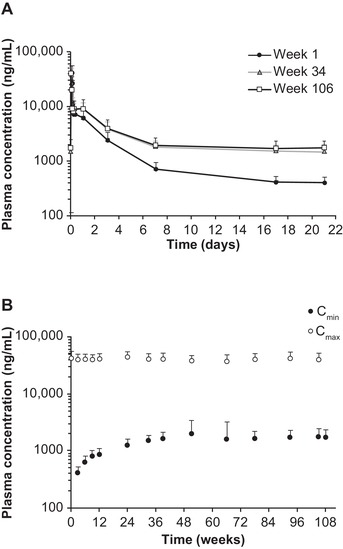
Plasma PK profiles for DLin‐MC3‐DMA following intravenous administration of patisiran 0.3 mg/kg once every 3 weeks for 24 months of treatment in the OLE study. (A) Mean DLin‐MC3‐DMA plasma concentration‐time profiles in weeks 1, 34, and 106. (B) Mean DLin‐MC3‐DMA plasma Cmin and Cmax over time. Error bar represents standard deviation. Cmax, maximum concentration at EOI; Cmin, concentration at the end of the dosing interval; DLin‐MC3‐DMA, (6Z,9Z,28Z,31Z)‐heptatriaconta‐6,9,28,31‐tetraen‐19‐yl‐4‐(dimethylamino)butanoate; EOI, end of infusion; OLE, open‐label extension; PK, pharmacokinetic.