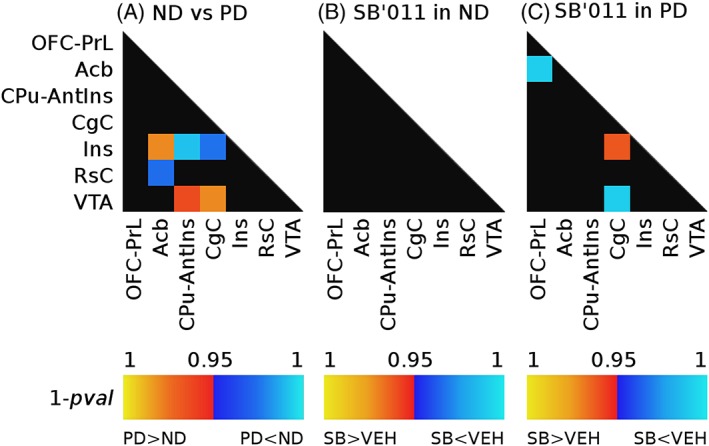
Figure 3.

Modulation of between component connectivity after exposure to ethanol A, and acute administration of SB‐277011‐a in the nondependent B, and the postdependent group C. Warm colors indicate an increase in functional connectivity, whereas reduction of connectivity strength is shown in cool colors
