
Figure 3.
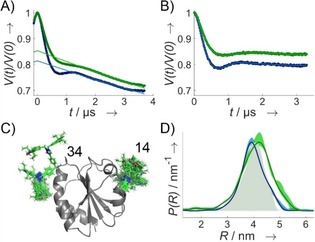
DEER data for TRX doubly labeled with M‐TEIO (blue, c spin=50 μm, c protein=34 μm) or Az‐TEIO (green, c spin=108 μm, c protein=90 μm) measured at Q‐Band at 50 K. A) DEER traces. B) Form factor obtained after 3D background correction. C) Crystal structure of TRX (PDB ID: https://www.rcsb.org/structure/2TRX)31 with attached rotamers for Az‐TEIO at pENF at position 14 and 34 of the primary protein structure. D) Distance distribution predicted using the rotamer library for Az‐TEIO (grey shaded areas), experimental distance distribution including validation.