Figure 5.

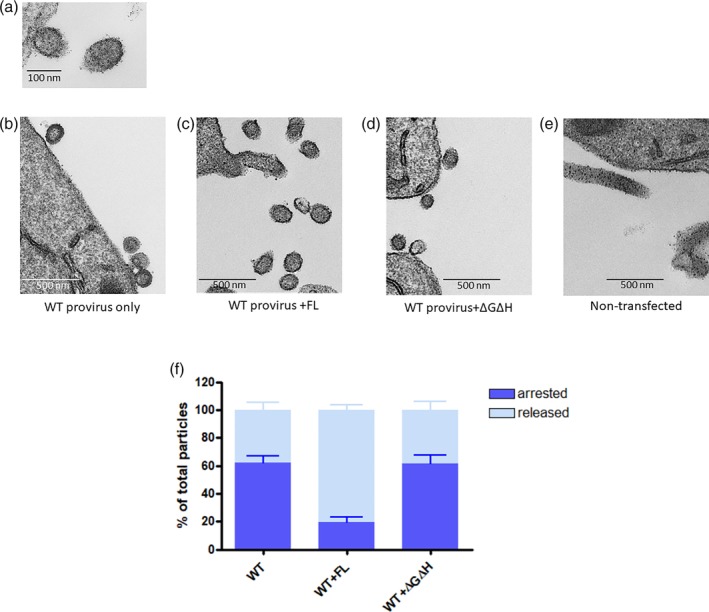
EM analysis of particles produced from transfected HAP1 EAP45 KO cells. (a and b): EM photographs show particles produced from the WT provirus‐transfected EAP45 KO cells (a and b), with EAP45 (full length [FL]; c) or with the ΔGΔH expressor (d) or nontransfected (e). Scale bar for (a) is 100 nm, whereas for (b–e), it is 500 nm. (f) Quantitation of the virus particles in each transfection condition that are either arrested at the plasma membrane or released into the extracellular compartment per field image, shown as % of total virus particles. Error bars represent the standard error of the mean of over 200 particles from a total of over 20 images
