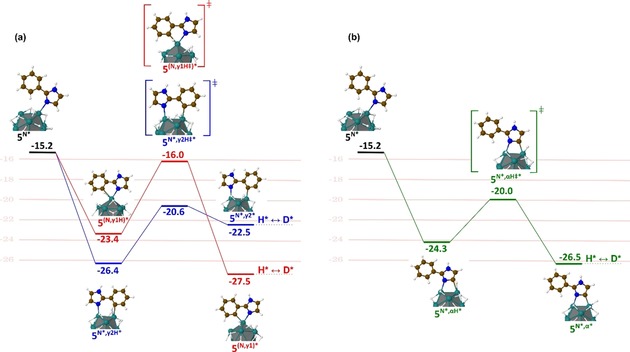
Figure 6.

a) Energy diagram for the Langmuir‐Hinshelwood‐type H/D exchange on 5 in the ortho‐position of the phenyl (blue and red pathways). b) at α‐positions relative to the imidazole nitrogen atoms (green pathway); energies are given in kcal mol−1. See also Figure S2 for a fully detailed pathway, that is, up to the final D‐incorporation.
