
Figure 3.
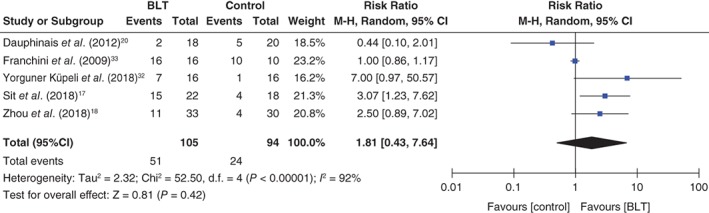
Forest plot of post‐intervention treatment effect sizes for remission rates from depressive episodes. BLT, bright light therapy; CI, confidence interval; SD, standard deviation.
Official websites use .gov
A
.gov website belongs to an official
government organization in the United States.
Secure .gov websites use HTTPS
A lock (
) or https:// means you've safely
connected to the .gov website. Share sensitive
information only on official, secure websites.
Forest plot of post‐intervention treatment effect sizes for remission rates from depressive episodes. BLT, bright light therapy; CI, confidence interval; SD, standard deviation.