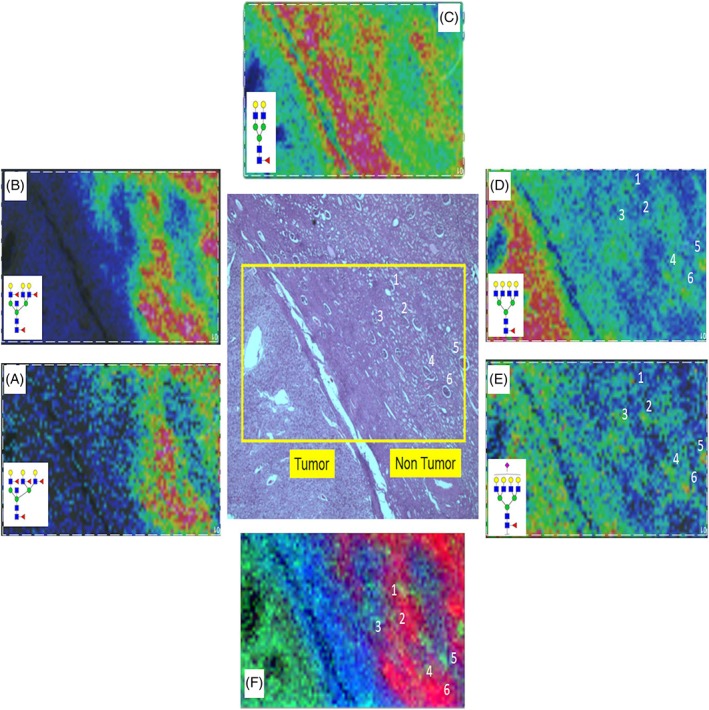
Figure 2.

N‐glycan profiles at the fibrillar interface between tumor and nontumor regions. Higher spatial resolution MALDI‐FTICR imaging MS of a highlighted region of the ccRCC Fuhrmann grade 2 tissue is shown. A,B, Bisecting GlcNAc structures (m/z = 2669.9667, Hex6HexNAc6Fuc3; m/z = 2816.0246, Hex6HexNAc6Fuc4) are associated with the proximal tubules. C, Detection of bi‐antennary glycan (m/z = 1809.6393, Hex5HexNAc4Fuc1) in fibrillar core. D,E, Weak but clear detection of glomeruli (annotations 1‐6) via tetra‐antennary glycans (m/z = 2539.9037, Hex7HexNAc6Fuc1; m/z = 2853.9983, Hex7HexNAc6Fuc1NeuAc1). Specific glomeruli are numbered in the H&E‐stained tissue for comparison with the N‐glycan images. F, Overlay of three N‐glycans showing clear distinctions between glomeruli, tubules, and fibrillar regions
