
Figure 6.
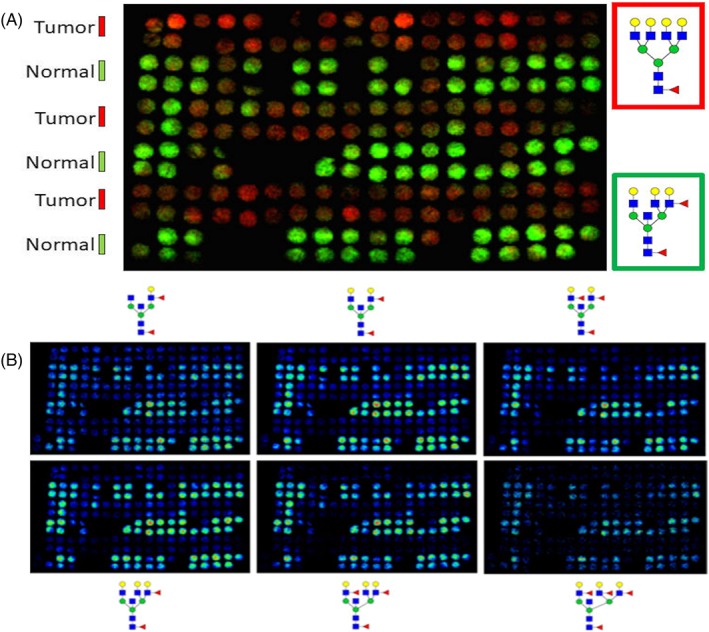
N‐glycan profiling of patient matched normal and tumor pairs for Stage 1 ccRCC. Patient match tumor and distal normal tumor cores, 2 per region, n = 58 donors, were assembled into a tissue microarray. A, Overlay of representative N‐glycan images between normal (green, m/z = 2523.9088, Hex6HexNAc6Fuc2) and tumor (red, m/z = 2539.9037, Hex7HexNAc6Fuc1) tissues. B, Normal samples from stage 1 ccRCC TMA show an abundance of bisecting GlcNAc and multifucosylated N‐glycans (Hex5HexNAc5Fuc1‐3, top panel; Hex6HexNAc6Fuc1‐3, bottom panel). Detection of these structures is generally absent in matched tumor samples. Additional data comparing the intensities of detected N‐glycans between tumor and normal tissues are provided in Figure S4