Figure 3.

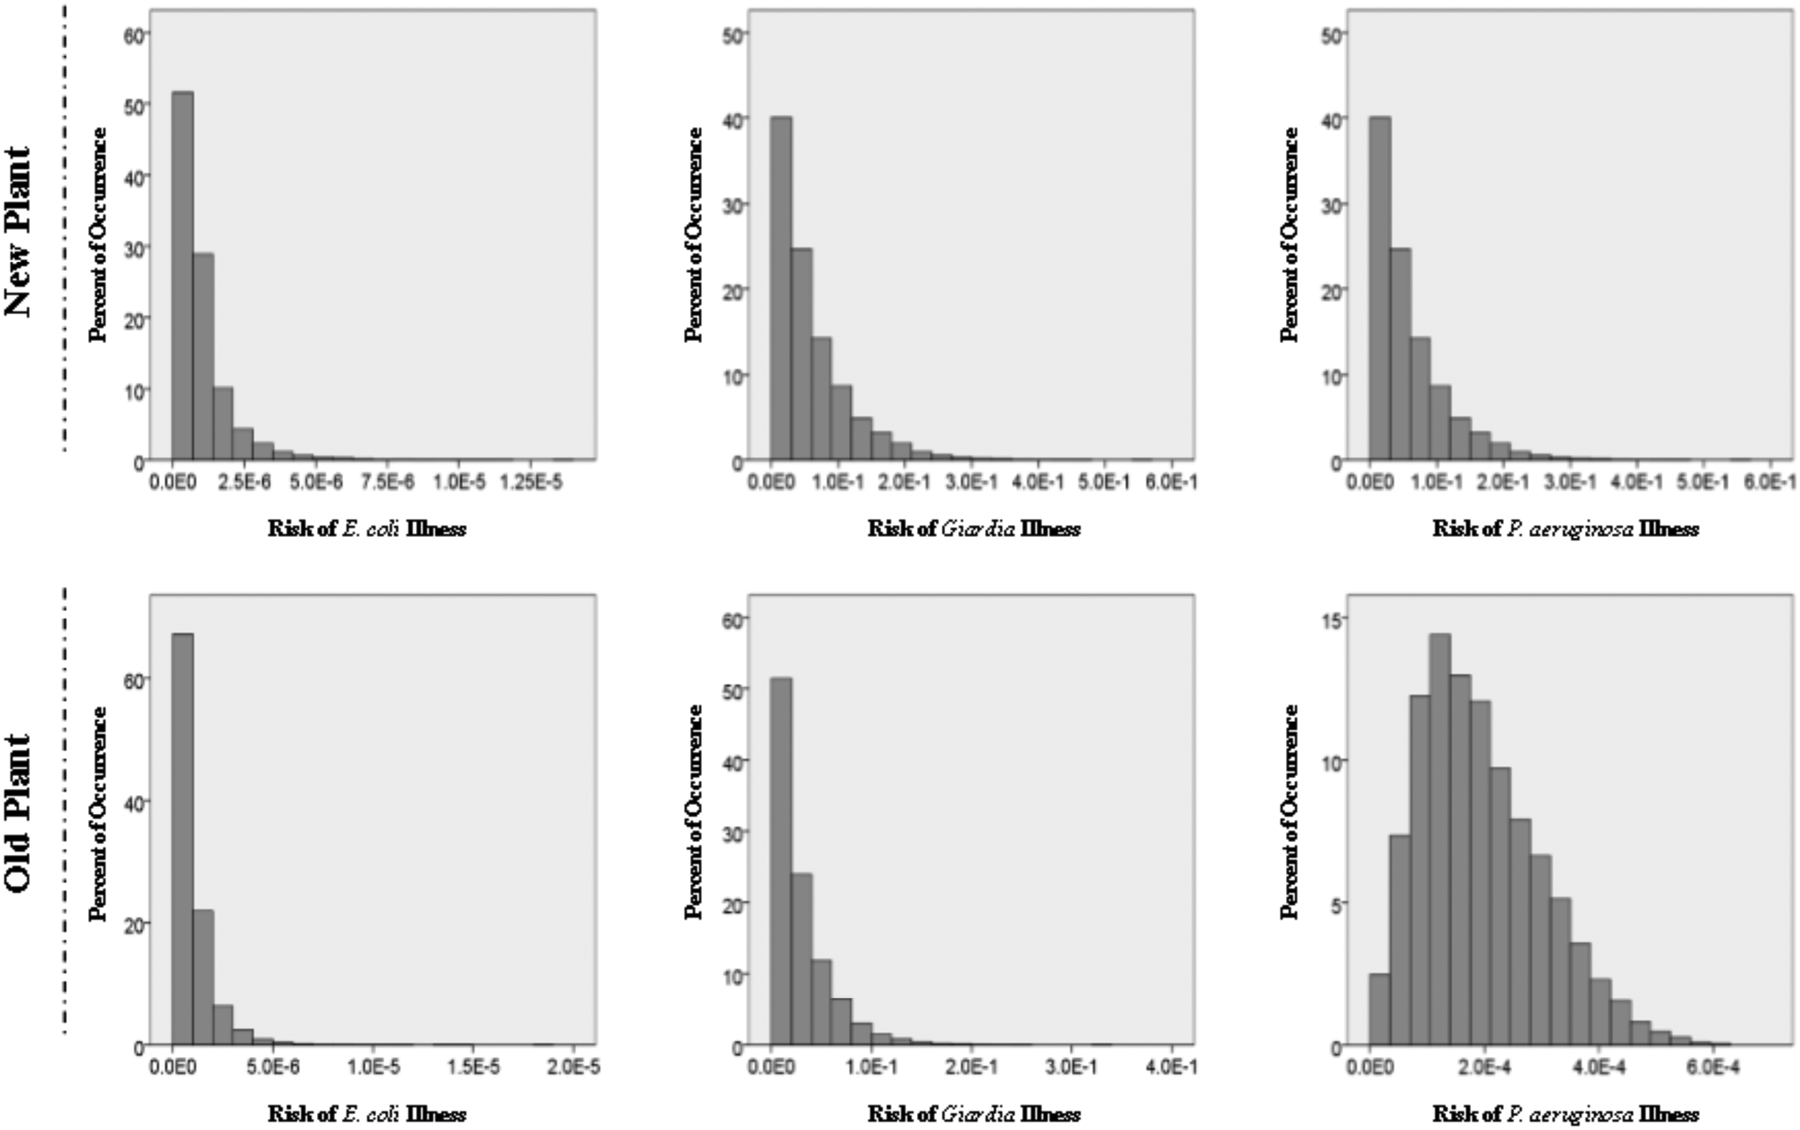
Annual risk estimates for the two potable treatment plants. Histograms depicting the percent of risk occurrences from 10,000 Monte Carlo iterations.

Annual risk estimates for the two potable treatment plants. Histograms depicting the percent of risk occurrences from 10,000 Monte Carlo iterations.