
Figure 1.
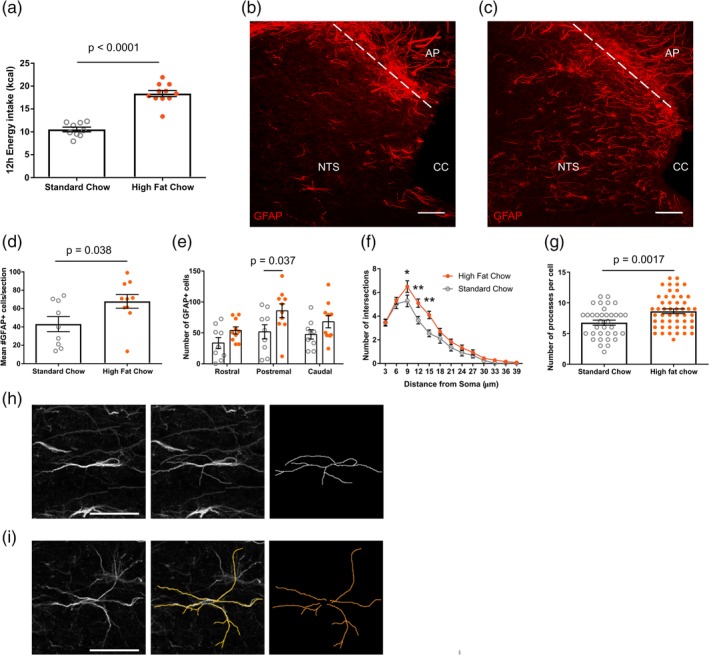
High‐fat chow intake increased the number and morphological complexity of astrocytes in the nucleus of the solitary tract (NTS). (a) Dark‐phase energy intake of standard and high‐fat chow fed mice (10.53 ± 0.51 vs. 18.37 ± 0.67 kcal, n = 9–10 mice/group, p < .0001, unpaired t test). (b,c) Representative maximum projection confocal image of glial‐fibrillary acidic protein (GFAP) immunostaining from a standard (b) and high‐fat (c) chow fed mouse, scale bar = 50 μm. (d) Mean number of GFAP positive cells from tissue sections of NTS from standard and high‐fat chow fed mice (43.09 ± 8.19 vs. 67.9 ± 7.47 cells, n = 9–10 mice/group, p = .038, unpaired t test). (e) Number of GFAP positive cells within anatomical subdivisions of NTS from standard (open gray circle) and high‐fat (closed orange circle) chow fed mice (n = 9–10 mice/group, two‐way analysis of variance [ANOVA], food, p = .0018, F (1,51) = 10.81; rostrocaudal position, p = .034, F (2,51) = 3.63; interaction, p = .7, F (2,51) = 0.36; Sidak's post hoc test). (f) Mean Sholl profile of postremal NTS astrocytes of standard and high‐fat chow fed mice (n = 35–50 cells from 4–5 mice/group, two‐way ANOVA, food, p < .0001, F (1,1,079) = 23.24; distance from soma, p < .0001, F (12,1,079) = 108.3; interaction, p = .04, F (12,1,079) = 1.83; Sidak's post hoc test). (g) Number of processes of individual postremal NTS astrocytes from standard and high fat chow fed mice (6.77 ± 0.41 vs. 8.62 ± 0.38 processes, n = 35–50 cells from 4–5 mice/group, p = .0017, unpaired t test). (h,i) Representative image and trace of a GFAP+ astrocyte from a standard (h) and high‐fat (i) chow fed mouse, scale bar = 25 μm. *p < .05, **p < .01. AP, area postrema; cc, central canal; NTS, nucleus of the solitary tract. Data are expressed as mean ± SE of the mean [Color figure can be viewed at http://wileyonlinelibrary.com]