Figure 5.

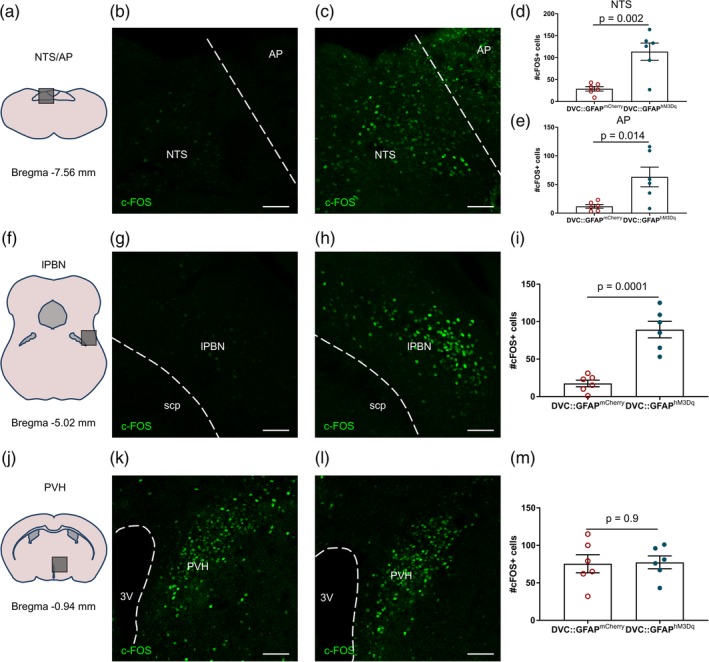
Chemogenetic astrocyte activation induced c‐FOS‐immunoreactivity in brainstem neural circuits in DVC::GFAPhM3Dq mice. DVC::GFAPmCherry and DVC::GFAPhM3Dq mice (n = 6 mice/group) were injected with CNO 2–3 hr prior to perfusion‐fixation. (a–c) Representative images of c‐FOS immunostaining from the dorsal vagal complex (DVC) of a DVC::GFAPmCherry mouse (b) and a DVC::GFAPhM3Dq mouse (c). (d,e) Quantification of c‐FOS immunoreactive cells in the nucleus of the solitary tract (NTS) (d) (29 ± 5.01 vs. 113.7 ± 19.62 cells, p = .002, unpaired t test) and AP (e) (11.83 ± 3.2 vs. 63.17 ± 17.2 cells, p = .014, unpaired t test). (f–h) Representative images of c‐FOS immunostaining from the lateral parabrachial nucleus (lPBN) of a DVC::GFAPmCherry mouse (g) and a DVC::GFAPhM3Dq mouse (h). (i) Quantification of c‐FOS immunoreactive cells in lPBN (17.5 ± 4.49 vs. 89.33 ± 11.08 cells, p = .002, unpaired t test). (j–l) Representative images of c‐FOS immunostaining from the lPBN of a DVC::GFAPmCherry mouse (k) and a DVC::GFAPhM3Dq mouse (l). (m) Quantification of c‐FOS immunoreactive cells in paraventricular nucleus of the hypothalamus (PVH; 75.5 ± 12.05 vs. 77.33 ± 8.58 cells, p = .90, unpaired t test). For all images, scale bar = 50 μm. AP, area postrema; lPBN, lateral parabrachial nucleus; NTS, nucleus of the solitary tract; PVH, paraventricular nucleus of the hypothalamus; scp, superior cerebellar peduncle. Data are expressed as mean ± SE of the mean [Color figure can be viewed at http://wileyonlinelibrary.com]
